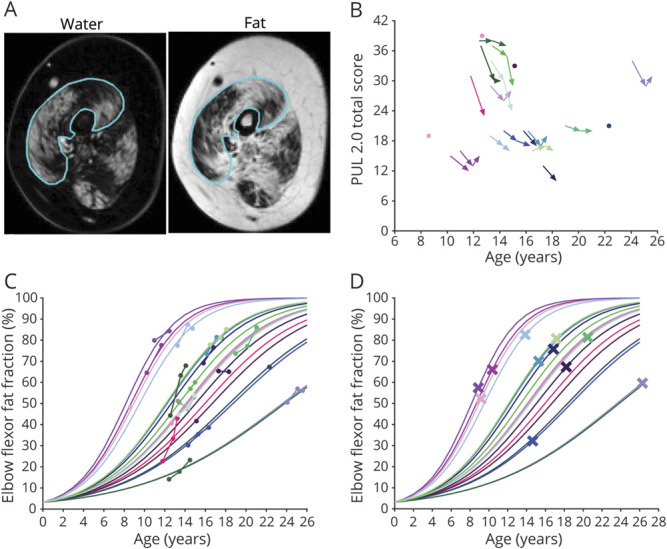
Figure 1. Longitudinal Clinical and FFEF Data.

(A) Example of a region of interest drawn on the elbow flexor muscles (line) is shown on a water image (left) and corresponding fat image (right). (B) Longitudinal performance of the upper limb (PUL) 2.0 total scores (maximum 42 points) are plotted vs age. PUL total scores decrease with age, but there is a large variation in scores between patients with Duchenne muscular dystrophy of similar ages. (C) Elbow flexor fat fraction (FFEF) results that were acquired are plotted vs age, as well as FFEF results that were predicted with a logit transformation, linear (mixed) model, and logistic transformation. Patients with higher FFEF results at younger ages or faster FFEF increases had steeper predicted FFEF slopes. (D) Predicted FFEF results are plotted vs age, and predicted FFEF at age at loss of hand-to-mouth movement is shown with a cross. Colors used in panels B–D are unique for each participant.
