
Figure 2. Elbow Flexor Fat Fraction and Preserved Hand-to-Mouth Movement vs Age.
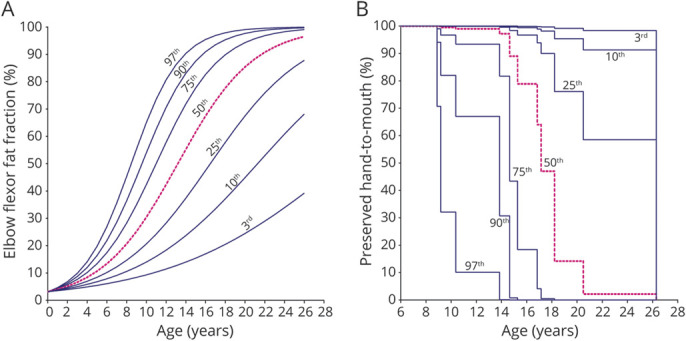
In (A) we generated an FFEF growth chart with a 3rd, 10th, 25th, 50th, 75th, 90th and 97th percentile curve from the predicted FFEF data. (B) Using the resulting hazard ratio, we transformed the predicted FFEF growth curves to a 3rd, 10th, 25th, 50th, 75th, 90th and 97th percentile survival curve for preserved hand-to-mouth movement. A patient on the 3rd percentile in the FFEF growth chart is also on the 3rd percentile in the survival chart.