
Figure 2. Discomfort Rating in Response to Spectral Pulses.
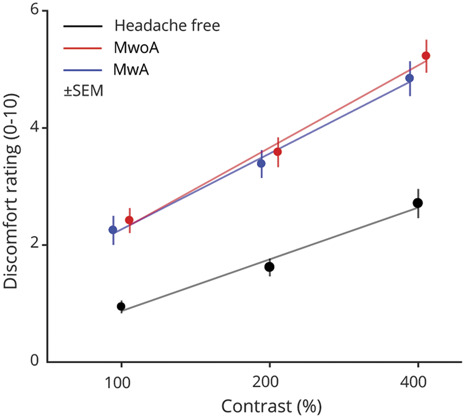
The average verbal discomfort rating on a scale of 0–10 within each group (n = 20 participants per group) is shown at each contrast level. The stimuli were presented at 3 different contrast levels (100%, 200%, and 400%), and these (log-spaced) values define the x-axis. The discomfort ratings for the 3 stimulus types were averaged across stimulus types within each group and shown as a filled circle. Error bars represent ±SEM. The best-fit line to the mean discomfort rating across participants as a function of log contrast is shown as a solid line for each group.