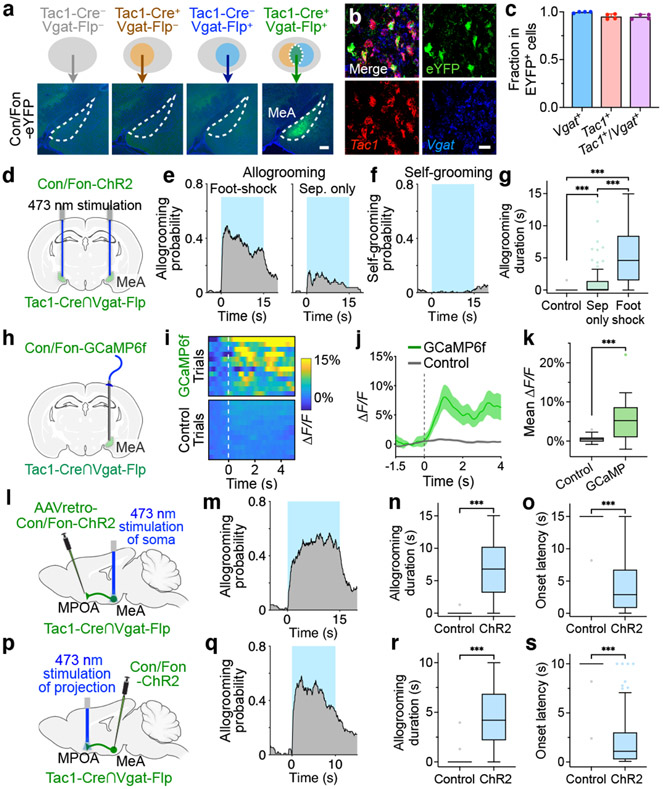
Fig. 4. MPOA-projecting MeATac1∩Vgat neurons drive allogrooming.
a, Example images of Con/Fon-EYFP expression in the MeA of Tac1-Cre+/Vgat-Flp+ (but not Tac1-Cre−/Vgat-Flp+, Tac1-Cre+/Vgat-Flp−, or Tac1-Cre−/Vgat-Flp−) animals. Scale bar, 200 μm. b, c, Example images (b) and quantification (c) showing the overlap between Tac1, Vgat, and Con/Fon-EYFP expression in the MeA of Tac1-Cre+/Vgat-Flp+ animals. Scale bar, 25 μm. d, h, l, p, Schematics of fiber photometry of MeATac1∩Vgat neurons (h) and ChR2 activation of MeATac1∩Vgat neurons (d), of retrogradely targeted MPOA-projecting MeATac1∩Vgat neurons (l), and of axonal projections of MeATac1∩Vgat neurons in the MPOA (p). e, g, Probability (e) and duration (g) of allogrooming toward foot-shocked or unstressed (“sep only”) partners during photostimulation (15-s) in control and ChR2 animals. f, Self-grooming probability during photostimulation in ChR2 animals. i–k, Example heatmaps (i) and average traces (j) showing Ca2+ signal changes aligned to allogrooming bouts and mean ΔF/F following allogrooming onset (k) in GCaMP or EYFP control animals. Time 0: allogrooming onset. m–s, Allogrooming probability (m, q), duration (n, r), and onset latency (o, s) during soma stimulation (15-s) of retrogradely targeted MPOA-projecting MeATac1∩Vgat neurons (m–o) or stimulation (10-s) of axonal projections of MeATac1∩Vgat neurons in the MPOA (q–s). e, f, m, q, Blue areas: stimulation duration; time 0: stimulation onset. c, j, mean ± s.e.m. Boxplots: median, quartiles, 1.5 × IQR, and outliers. ***P < 0.001. For details of statistical analyses and sample sizes, see Supplementary Table 1.

