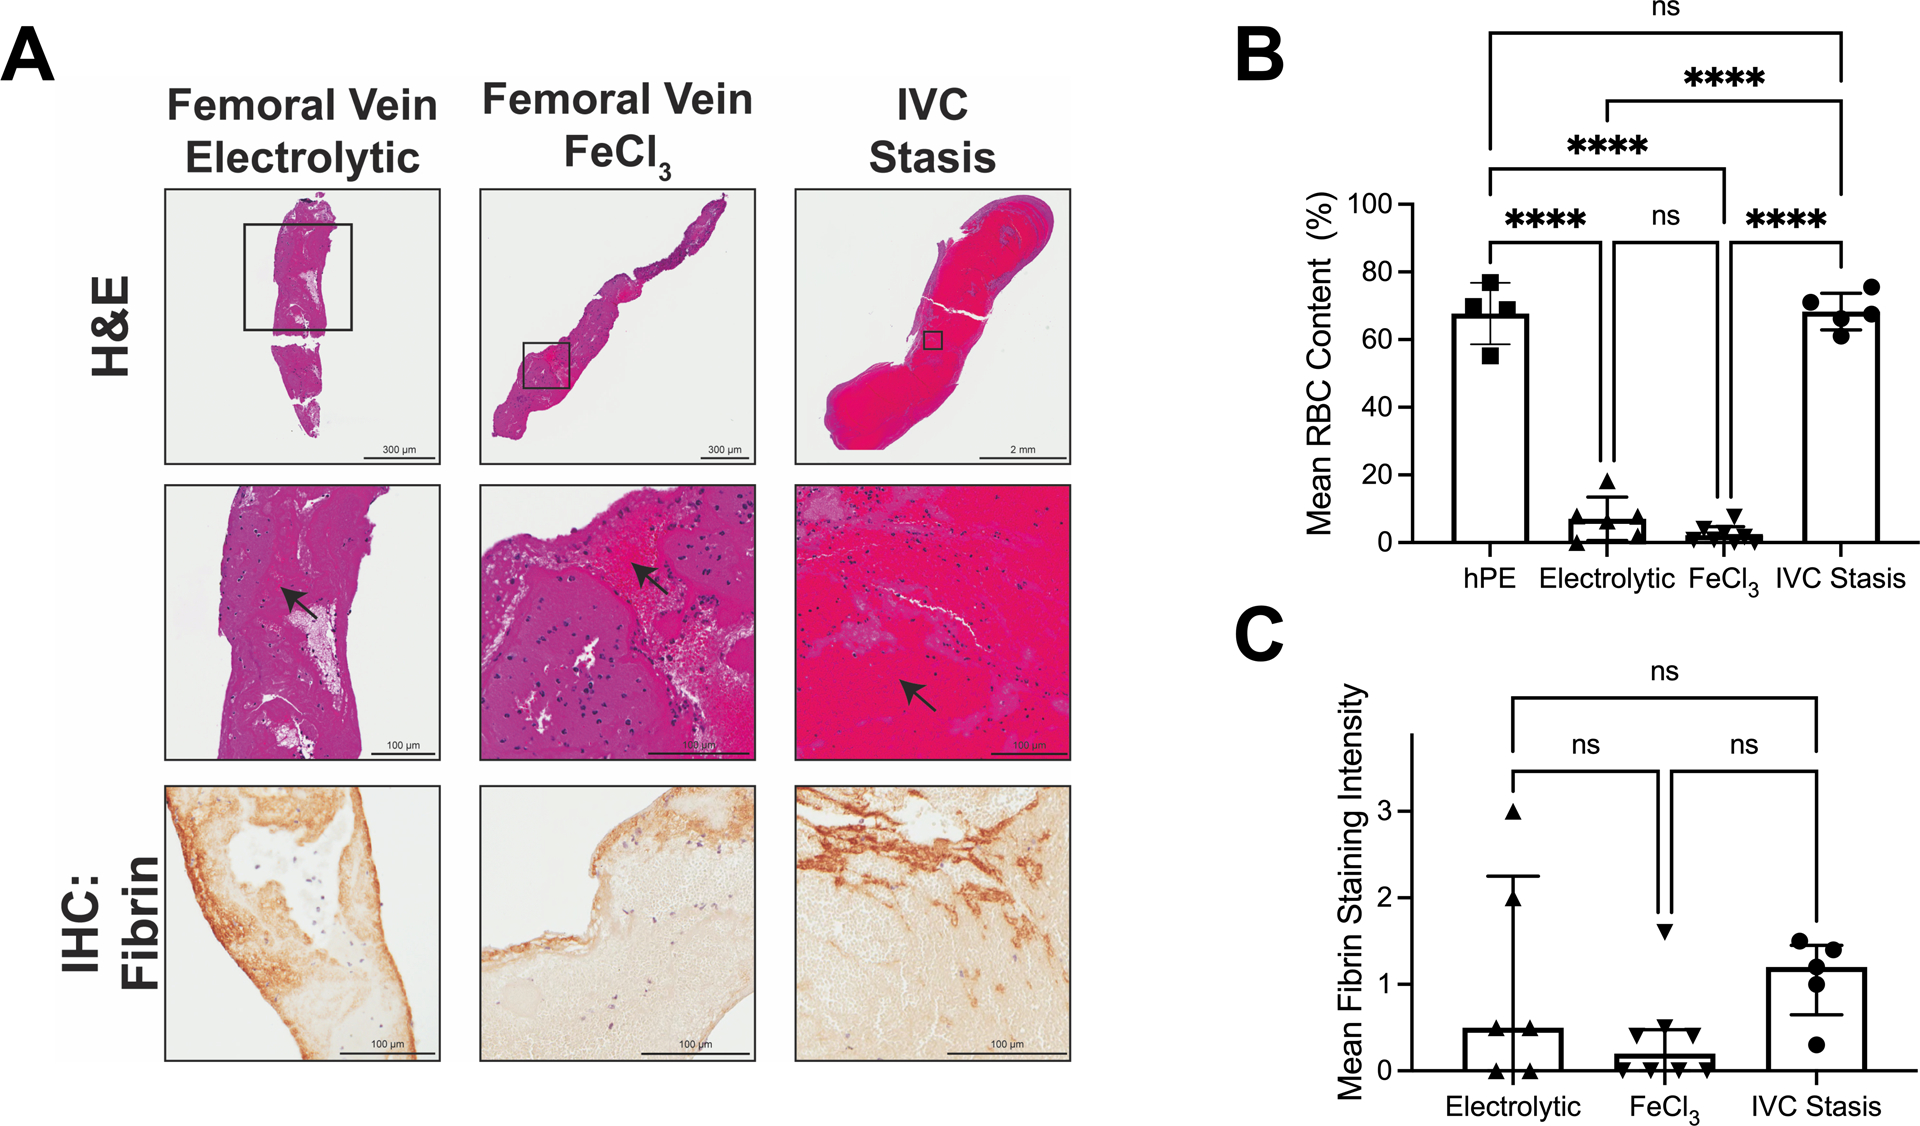
Figure 2. Femoral vein electrolytic and FeCl3 models produce small thrombi with low RBC- and fibrin-content, whereas IVC stasis produces large, RBC-rich thrombi.

Thrombosis was induced using femoral electrolytic injury (N=6), femoral FeCl3 injury (N=8), and IVC stasis (N=5). (A) Representative whole thrombi (top row) and enlarged images (middle row) stained by H&E, and fibrin staining (brown, bottom row). Black arrows indicate areas rich in RBCs. (B) RBC content of thrombi from each model; data on human PE (hPE) are reproduced from Figure 1G. (C) Fibrin staining intensity of thrombi from each model. RBC data were normally distributed and compared using one-way ANOVA. The fibrin intensity data were not normally distributed and were compared using Kruskal-Wallis testing. Dots represent individual mice; columns and error bars indicate mean and standard deviation for RBCs, and median and interquartile range for fibrin. ****P<0.0001; ns, non-significant
