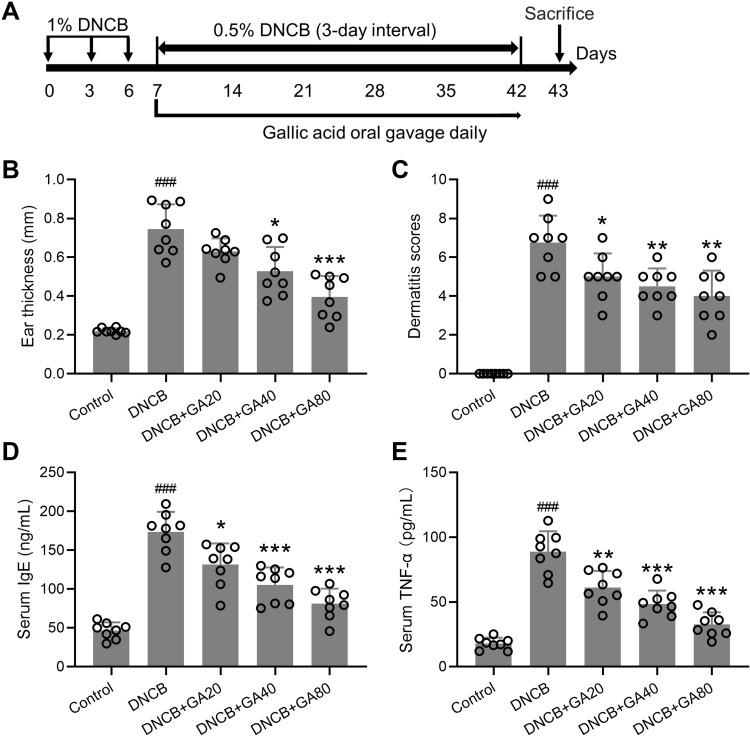
Figure 1.
Experimental design and observation indicators. (A) Schematic diagram of the study protocol. (B) Comparisons of ear thickness at the end of experimental procedure. (C) Effects of gallic acid on atopic dermatitis-like skin severity induced by DNCB. (D and E) Effects of gallic acid on serum levels of IgE (D) and TNF-α (E) in atopic dermatitis-like mice. Mean ± SD was used to shown the data. ###p < 0.001 compared to control, *p < 0.05, **p < 0.01, ***p < 0.001 compared to DNCB group. One-way ANOVA followed Dunn’s multiple comparisons test.

