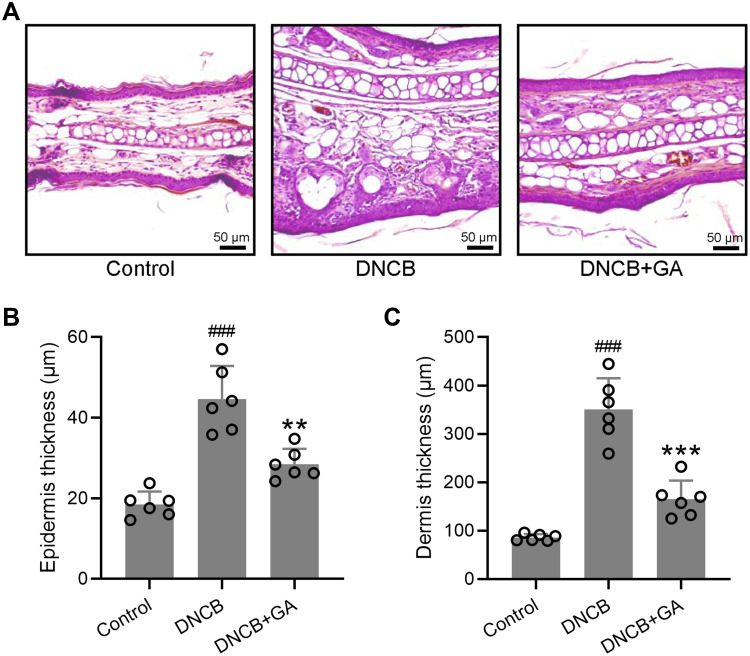
Figure 2.
Histopathological observation of ear tissues from DNCB induced atopic dermatitis-like mice. (A) Representative images of hematoxylin-eosin staining for ear skin. The comparison of thickness of the epidermis and dermis (B and C). Mean ± SD was used to shown the data. ###p < 0.001 compared to control, **p < 0.01, ***p < 0.001 compared to DNCB group. One-way ANOVA followed Dunn’s multiple comparisons test.

