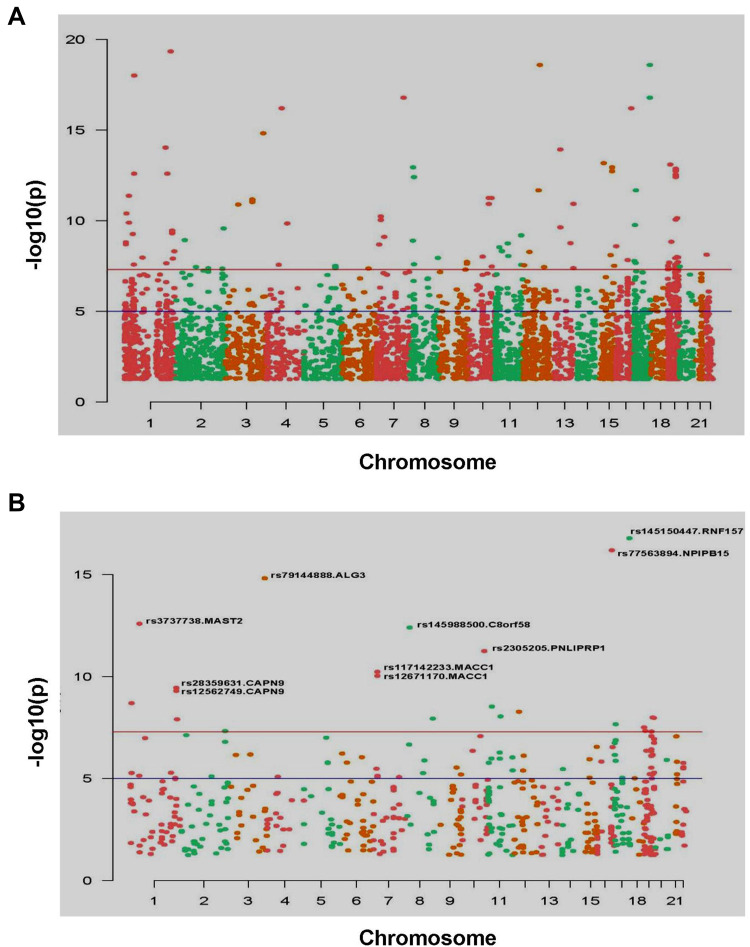
Figure 3.
Manhattan map of all SNP sites (A) and Manhattan map of significant SNP mutation sites, marks the SNP sites with high significance (P<1e-9) (B).
Note: X-axis was the position of the chromosome where the SNP was located. Y-axis was the -log10(P) value corresponding to each SNP site. -log10(P) reflects the degree of association between mutation site and disease occurrence. The greater the value of -log10(P), the stronger the association. The blue horizontal line cutoff value was P=1e-5, and the red horizontal line cutoff value was P=1e-8.

