Figure 4.
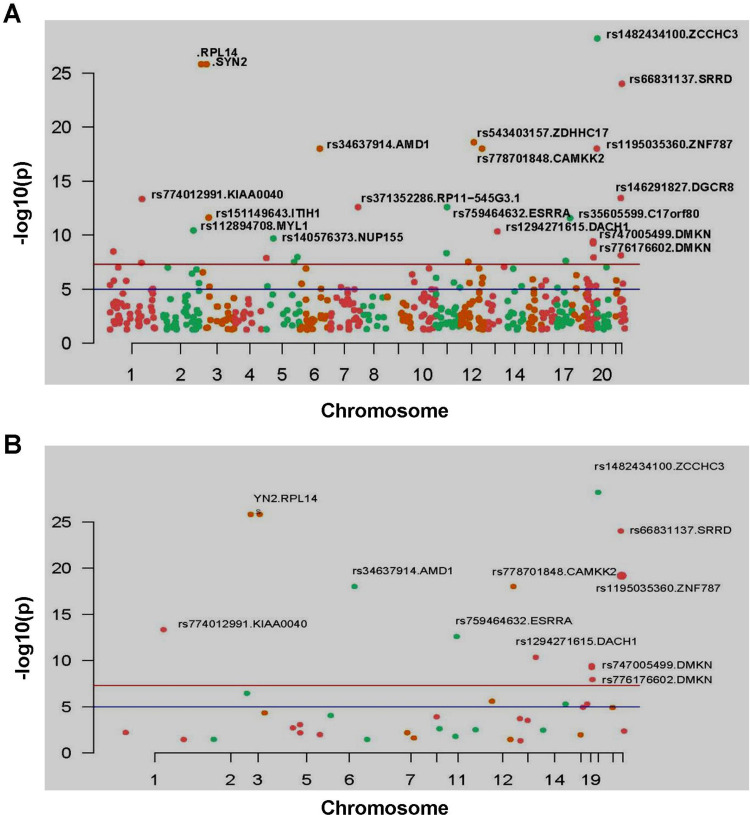
Manhattan map of all Indel mutation sites (A) and Manhattan map of Indel mutation sites that can change the function of protein, and marks the Indel site with high significance (P<1e-9) (B).
Note: X-axis is the position of the chromosome where the Indel is located. Y-axis is the -log10(P) value corresponding to each Indel mutation site; -log10(P) reflects the degree of association between mutation site and disease occurrence. The greater the value of -log10(P), the stronger the association. The blue horizontal line cutoff value was P=1e-5, and the red horizontal line cutoff value was P=1e-8.

