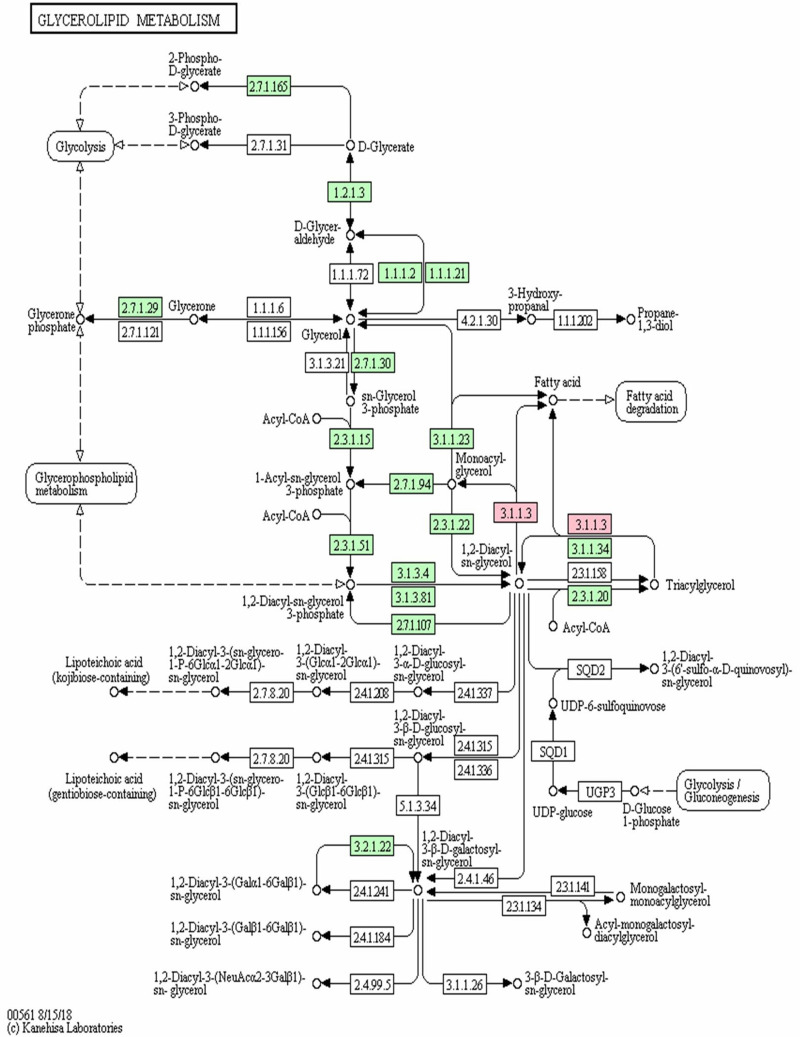
Figure 6.
The KEGG pathway map of PNLIPRP1 involved in the process of triglyceride metabolism.
Note: The rectangle in the figure indicates the enzyme that catalyzes the reaction. Each enzyme is labeled with the EC (Enzyme Commission) number. The circles in the figure indicate the reaction substrate and product. 3.1.1.3 in pink was pancreatic lipase.

