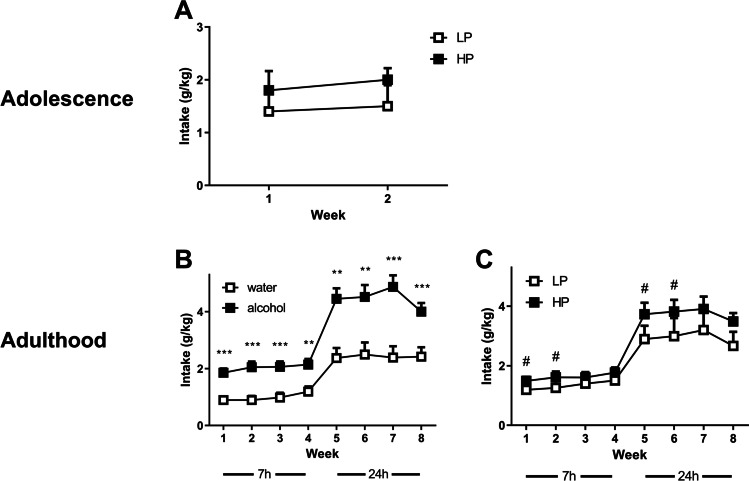
Fig. 3.
Alcohol intake for the selected groups of low and high playing rats that were allowed to drink either alcohol or water during adolescence. A The alcohol intake during adolescence is shown (LP N = 9, HP N = 14). B The levels of alcohol intake (g/kg) in adulthood, in 7-h (weeks 1–4) and 24-h (weeks 5–8) sessions, by water (N = 22) or alcohol (N = 23) pre-exposure. C The levels of alcohol intake (g/kg) for the same rats, grouped by low (LP, N = 16) or high (HP, N = 29) tendency to engage in social play behaviour. Shown are the average + SEM levels of weekly alcohol intake per group. Post hoc pairwise comparisons: ** or *** significant difference between adolescent water and adolescent alcohol (p < 0.01 or p < 0.001, respectively); # significant difference between low and high playing rats (p < 0.05)

