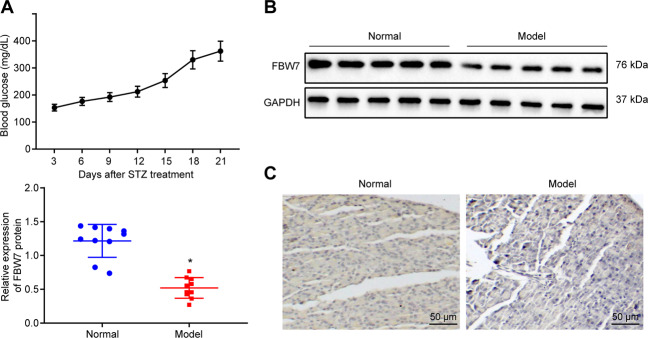
Fig. 1. FBW7 is under-expressed in the T1D mouse model.
A The blood glucose level in the mouse model. B Western blot results of FBW7 expression in islets from T1D mice (n = 10) and control mice (n = 10), *p < 0.05, vs. the normal group. C Representative images of IHC for FBW7 expression in islets from T1D mice and control mice with arrows pointing at cells positive for FBW7 (bar = 25 μm). Measurement data are presented. Data comparisons between two groups were analyzed by unpaired t-test. Statistical analysis in relation to time-based measurements within each group was realized using repeated-measures ANOVA.

