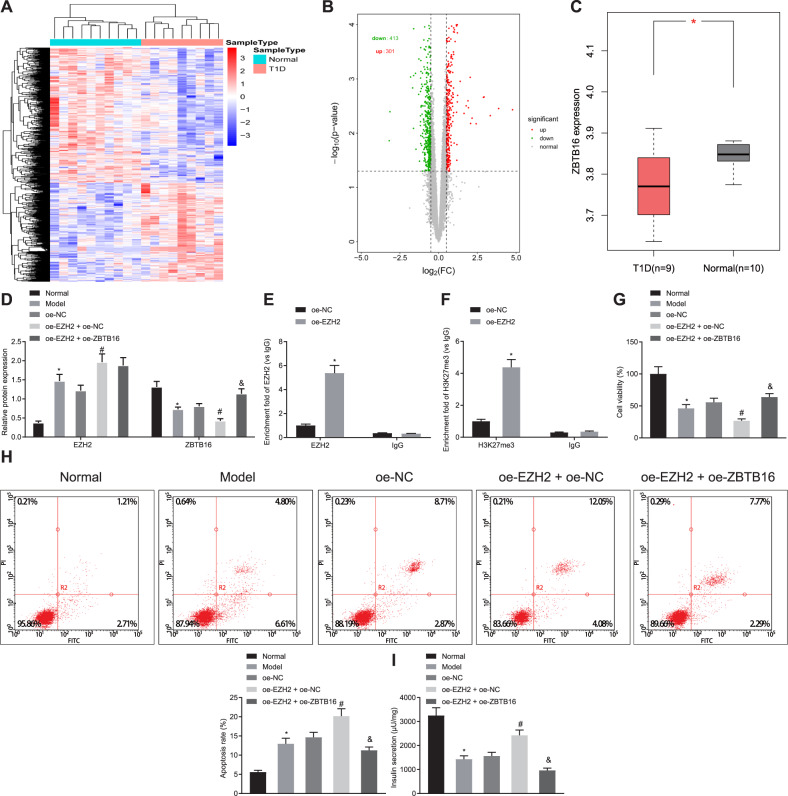
Fig. 4. EZH2 enhances TNF-α-induced pancreatic beta-cell apoptosis and dysfunction through ZBTB16 methylation.
A Clustering heat map of differentially expressed genes in a T1D-related dataset, each row represents a gene, and each column represents a sample. B Volcano map of differentially expressed genes in T1D-related dataset, each dot represents a gene, where red dots indicate up-regulation and green dots indicate down-regulation. C The expression of ZBTB16 in the dataset, red indicates T1D samples, gray indicates normal tissue samples. D Western blot assay of the EZH2 and ZBTB16 proteins in the EZH2-, or with ZBTB16-, overexpressed Min6 cells, *p < 0.05 vs. the normal group, #p < 0.05 vs. the OE-EZH2 + OE-NC group, &p < 0.05 vs. the OE-EZH2 + OE-ZBTB16 group. E ChIP assay for detecting EZH2 accumulation in ZBTB16 promoter, *p < 0.05 vs. the OE-NC group. F ChIP assay for detecting H3K27me3 accumulation in ZBTB16 promoter, *p < 0.05 vs. the OE-NC group. G CCK-8 assay for cell variability, *p < 0.05 vs. the normal group, #p < 0.05 vs. the OE-EZH2 + OE-NC group, &p < 0.05 vs. the OE-EZH2 + OE-ZBTB16 group. H Flow cytometry assay for apoptosis, *p < 0.05 vs. the normal group, #p < 0.05 vs. the OE-EZH2 + OE-NC group, &p < 0.05 vs. the OE-EZH2 + OE-ZBTB16 group. I Determination of insulin secretion, *p < 0.05 vs. the normal group, #p < 0.05 vs. the OE-EZH2 + OE-NC group, &p < 0.05 vs. the OE-EZH2 + OE-ZBTB16 group. All experiments were conducted in triplicate. Data comparisons between two groups were analyzed by unpaired t-test. Comparisons among multiple groups were performed by one-way ANOVA.

