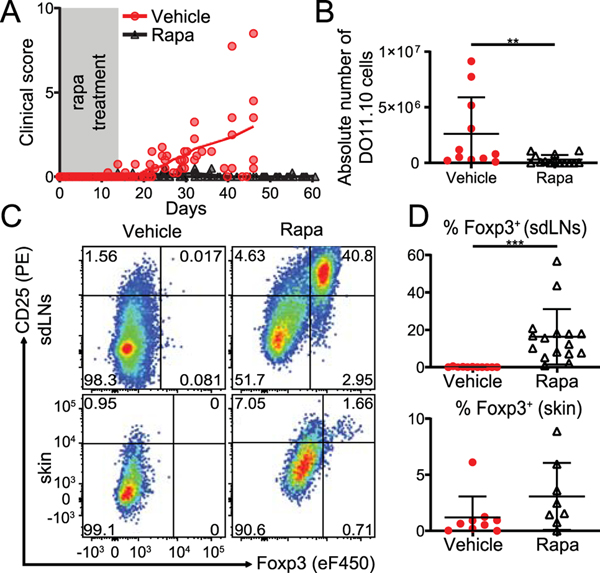
Figure 2: High mTOR activation inhibits pTreg generation in INV/TGO mice.
OVA expression in the skin was induced with 1200 μg dox/mL and 0.5–0.9×10⁶ LN cells from DO11.10 Rag2−/− animals were transferred into INV/TGO mice. Starting a day before adoptive transfer, mice were treated with either rapamycin (1 μg/g of body weight) or vehicle i.p. injections daily for 16 days. (A) Clinical disease course over the duration of the experiment (representative of 4 experiments, N ≥ 16/group in total). (B) Absolute number of recovered DO11.10 cells from sdLNs between 41–89 days. (C) Representative flow plots of DO11.10 cells recovered from sdLNs or skin (67 and 89 days after transfer in vehicle and rapa treated groups, respectively). (D) Percentages of Foxp3+ DO11.10 cells recovered from the sdLNs (top) and the skin (bottom) between days 41–67 (vehicle) and 71–89 (rapa). B, D show Cumulative data from 4 experiments, N ≥ 8/group. Mean and SD is shown.

