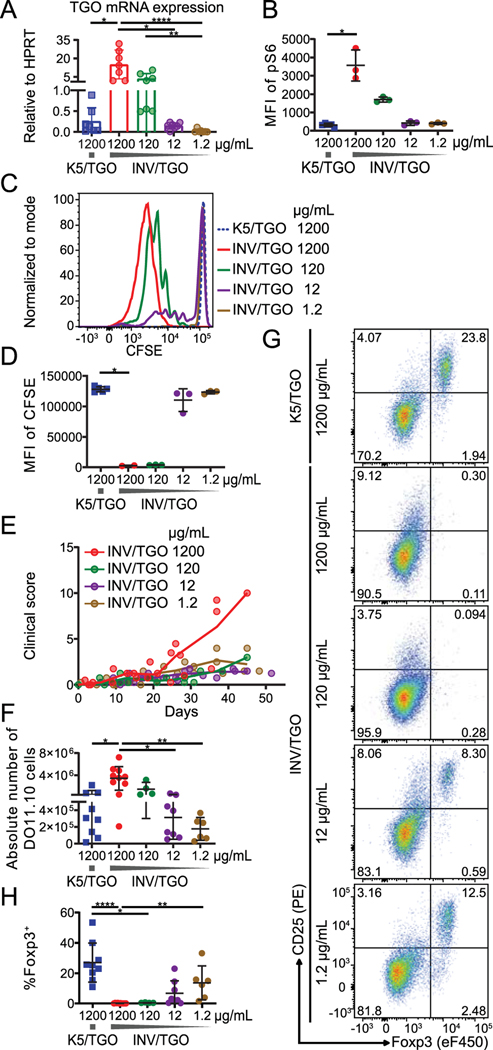
Figure 3: T cell activation and differentiation depends on dose of tissue antigen in INV/TGO mice.
OVA expression was induced by the indicated doses of dox (1200 – 1.2 μg/mL) and 0.9–2×10⁶ CFSE-labeled (A-D) or 0.8–1×10⁶ unlabeled (E-H) LN cells from DO11.10 Rag2−/− mice were transferred to K5/TGO or INV/TGO mice. (A) TGO mRNA expression in the skin analyzed by RT-PCR 2–4 days after dox administration. (B) sdLNs were isolated after 2–4 days, immediately fixed ex vivo and pS6 stained for flow cytometry. The Median fluorescence intensity (MFI) of pS6 in transferred DO11.10 cells is plotted (representative of 2 experiments, N ≥ 4/group in total). (C, D) Representative overlay of the CFSE dilution and summary graph of the MFI of CFSE in live DO11.10 cells in the sdLNs after 2–4 days (representative of 2 experiments, N ≥ 4/group in total). (E) Clinical disease course over the duration of the experiment (representative of 2 experiments, N ≥ 5/group in total) (F) Absolute number of live CD4+ DO11.10 cells in sdLNs after 22–57 days. (G) Representative flow plots of the expression of Foxp3 and CD25 by live CD4+ DO11.10 cells from sdLNs 46 days after transfer. (H) Percentages of live CD4+ Foxp3+ DO11.10 cells in the sdLNs after 22–57 days. F-H show cumulative data from 4 experiments, N ≥ 4/group. Mean and SD is shown.

