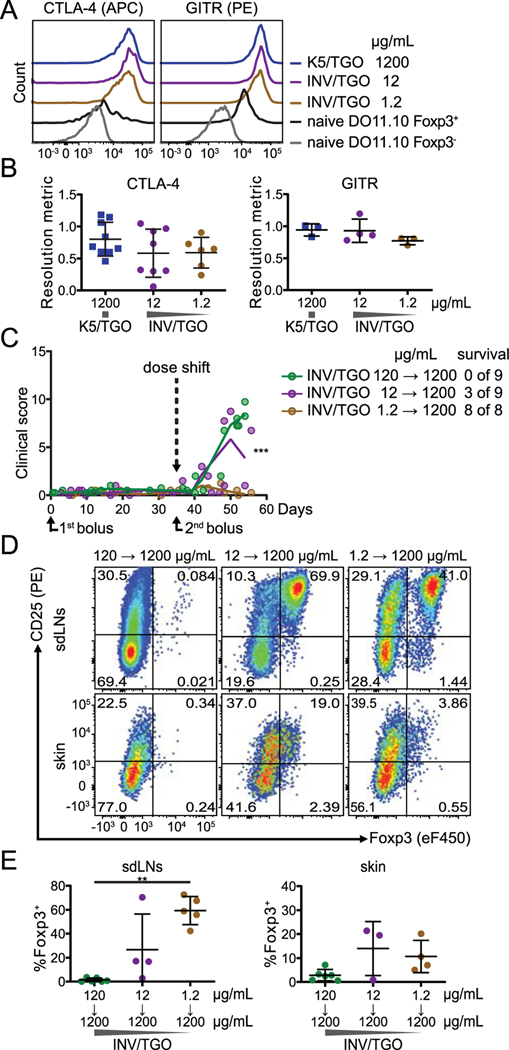
Figure 4: Low dose of tissue antigen favors the generation of stable Foxp3+ cells.
(A and B) OVA expression was induced by the indicated doses of dox (1200, 12, 1.2 μg/mL) and 0.875–1×10⁶ LN cells from DO11.10 Rag2−/− mice were transferred to K5/TGO or INV/TGO mice. Cells were isolated from sdLNs between 22–57 days after transfer. (A, B) Representative overlays (on day 50) and summary graphs displaying the intracellular expression of CTLA-4 (left) or the surface expression of GITR (right) by Foxp3+ DO11.10 cells compared to naïve Foxp3+ tTreg and Foxp3- cells isolated from DO11.10+ Rag2-sufficient mice (all populations gated on live CD4+ DO11.10+). Cumulative data from 3 experiments, N ≥ 3/group. (C, D and E) OVA expression in the skin was induced by different doses of dox (120 – 1.2 μg/mL) and 0.5–0.9×10⁶ LN cells from DO11.10 Rag2−/−CD90.1+/+ mice were transferred into INV/TGO mice. On day 35, 0.9 ×10⁶ LN cells from DO11.10 Rag2−/−CD45.1+/+ mice were transferred into the mice as a second bolus and the dose of dox was shifted to 1200 μg/mL for all groups. (C) Clinical disease course over the duration of the experiment (N ≥ 2/group). The slopes of the curves after the dose shift are significantly different (p= 0.0004). Survival was determined by day 54 after transfer. (D) Representative flow plots of the CD90.1+/+ DO11.10 population (i.e. first bolus) isolated from sdLNs or skin 56–90 days after transfer (from left to right). (E) Percentages of Foxp3+ cells of CD90.1+/+ DO11.10 cells isolated from the sdLNs (left) and the skin (right) 56–90 days after transfer. Cumulative data from 3 experiments, N ≥ 3/group. Mean and SD is shown.

