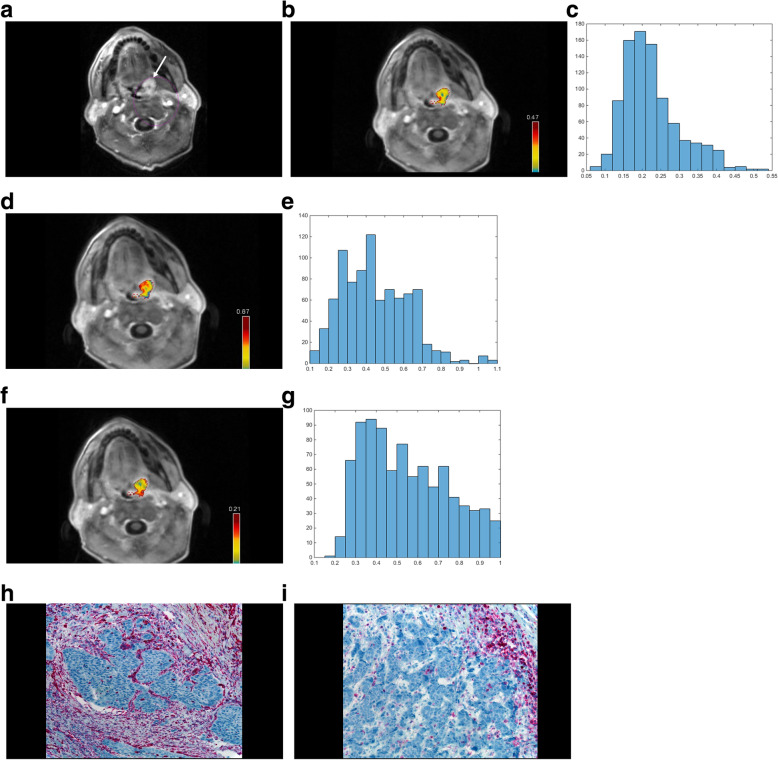
Fig. 1.
Representative case of the patient sample with a tumor of the left tonsil. A. T1-weighted sequence after contrast media application with fat saturation. A. tumor of the left tonsil with relative homogeneous contrast enhancement can be appreciated. B. Color coded map of the Ktrans values. An inhomogenous tumor can be appreciated with over all intermediate Ktrans values. The tumor is measured on all tumor displaying slices. C. The corresponding histogram of the Ktrans values (all parameters are given in 1/min) with the resulting values: mean 0.22, minimum 0.06, maximum 0.5, P10 0.14, P25 0.17, P75 0.26, P90 0.34, median 0.20, mode 0.20, kurtosis 3.93, skewness 1.01, entropy 3.23. D. Color coded map of the Kep values. Overall, homogenously intermediate to high Kep values can be seen. E. The corresponding histogram of the Kep values (all parameters are given in 1/min): mean 0.45, minimum 0.1, maximum 1.09, P10 0.23, P25 0.31, P75 0.57, P90 0.68, median 0.42, mode 0.29, kurtosis 3.23, skewness 0.60, entropy 3.72. F. Color coded map of the Ve values. Inhomogenously, intermediate Ve values can be appreciated. G. The corresponding histogram of the Ve values (unitless). Mean 0.55, minimum 0.19, maximum 1.0, P10 0.31, P25 0.38, P75 0.71, P90 0.85, median 0.52, mode 0.3, kurtosis 2.13, skewness 0.42, entropy 3.87. H. The corresponding vimentin-stained specimen (20-fold magnification) of this patient. There is no relevant staining of this specimen. The stroma/tumor ratio is 40:60. I. The corresponding CD45-stained specimen. The expression of TIL in the tumor compartment is 1% and within the stroma compartment is 50%

