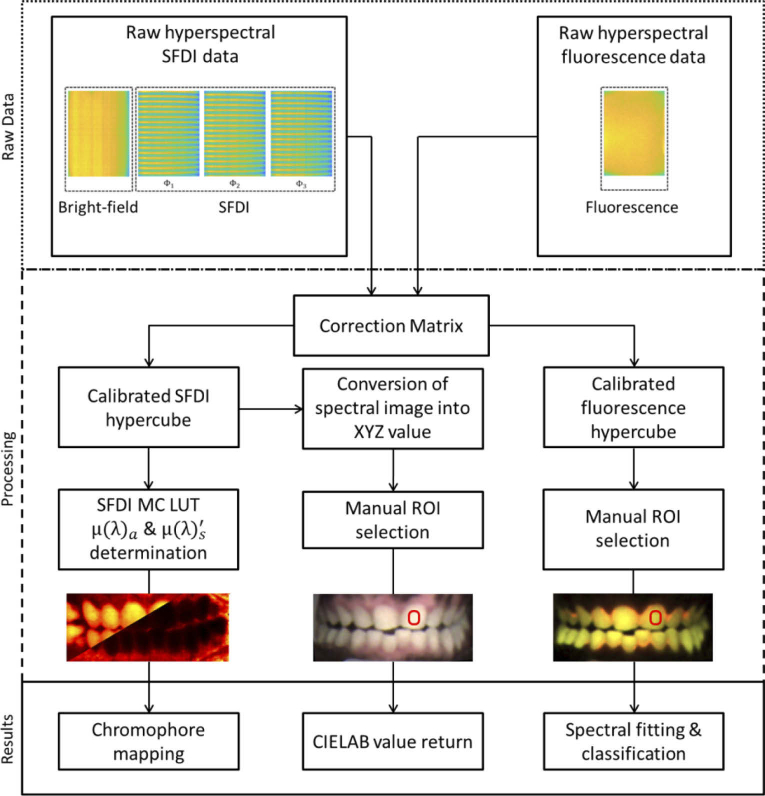
Fig. 3.
Flow chart of the Hy-F-SFDI system data processing. Raw data is first acquired. In the processing steps, a correction matrix is applied and data is converted into a hypercube. Next, SFDI scattering & absorption, CIELAB, and fluorescence maps are created. Finally the parameter calculation algorithms are applied for generating results.

