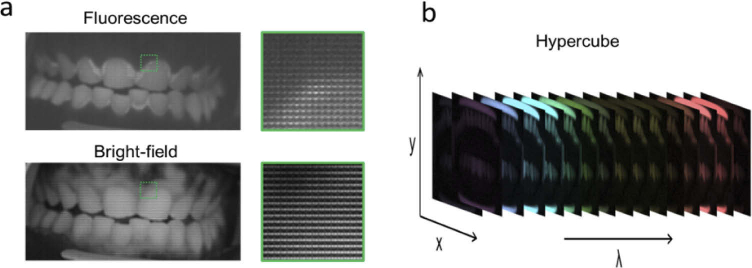
Fig. 4.
(a) Example of the raw hyperspectral fluorescence (top) and bright-field (bottom) images acquired from a volunteer. A zoomed image from the raw data, indicated by the green square in the image, is displayed to show the 4X4 filter matrix over the pixels. Porphyrin emission can visually be distinguished from the raw fluorescence image around the hard and soft tissue, but is not obvious in the bright-field. (b) Example of a reconstructed hypercube displaying the spectral imaging ability of the detector.

