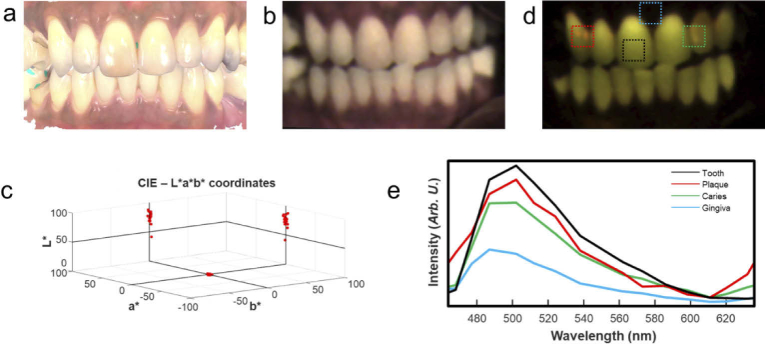
Fig. 9.
White light and autofluorescence analysis of tissue hygiene. (a) An en-face white light image acquired by an intraoral 3D scanner. The color information is not correctly calibrated, contains specular reflection, and is saturated for display. (b) Reconstructed white light image of the oral cavity using Hy-F-SFDI. (c) CIELAB measurements of 17 visible teeth. The molar implants have higher L values in the reconstructed image. (d) Pseudo colored fluorescence image displaying hard-tissue, caries and porphyrin fluorescence. (e) Measured spectra of different sections of the oral cavity. The spectra are averaged from the region indicated by the boxes in (d).

