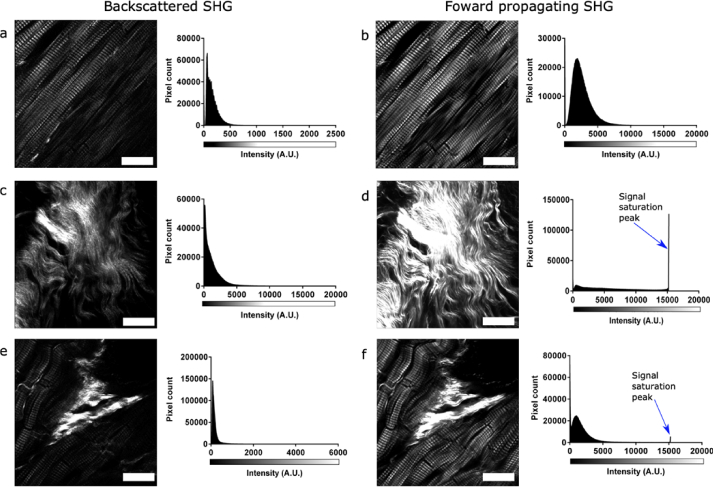
Fig. 2.
Comparison of forward and backscattered SHG signal in adult marmoset cardiac tissue. Representative SHG images are shown for the same regions for backscattered (epi-) (left panel) and forward (right panel) detection with their respective histograms. Images and histograms are shown for SHG from different structures including (a-b) myosin (excitation power 120 mW) (c-d) collagen (excitation power 120 mW) and (e-f) both myosin and collagen (excitation power 120 mW). Scale bar: 25 µm in all images. All histograms are presented in a 16-bit image format.

