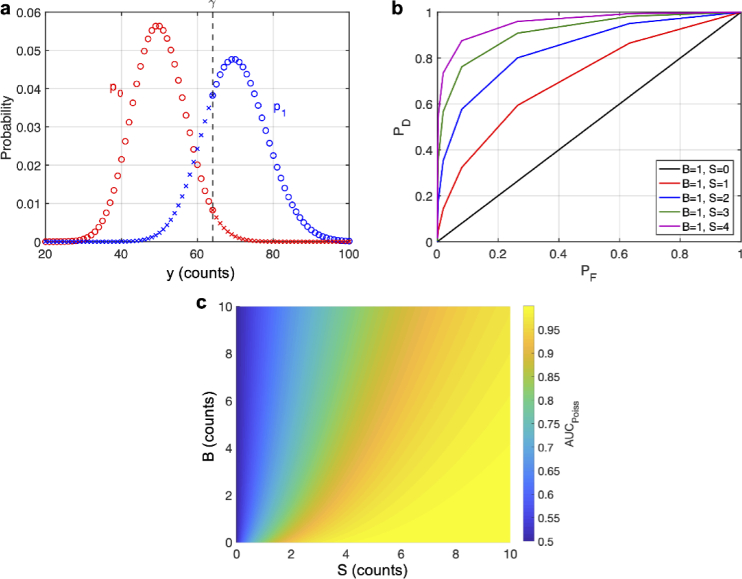
Fig. 1.
Statistical Theory. (a) Graph of the probability distributions (in red) and (in blue) with arbitrary means. A decision threshold, , is shown as a black dashed line at an arbitrary location. Blue circles show true positives and red circles show true negatives, while red x’s show false positives and blue x’s show false negatives. The points on the cutoff have both symbols to indicate that randomization may be used here. (b) ROC curves using randomization for various values of S and B. (c) Integrating under the ROC curve gives the AUC which is shown for various values of S and B. The infinite sum in Eq. (15) was computed by setting the upper limit to 100. The accuracy of this was checked by computing the sum with the upper limit set to 200, which showed little difference (see Fig. S1).

