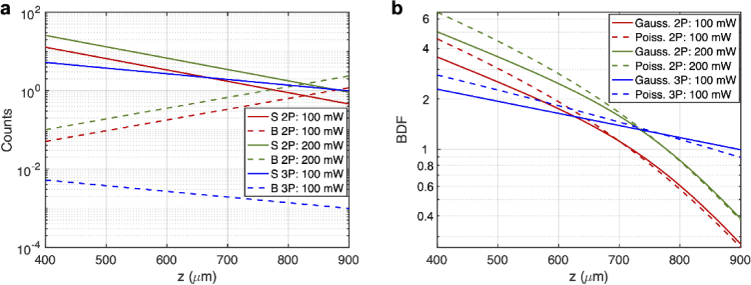
Fig. 4.
Comparison of 2P and 3P image quality when imaging the same fluorophores (e.g., GCaMP6). (a) Calculation of the S and B as a function of imaging depth for 2P and 3P imaging. S was calculated under an average power at the surface (100 mW for 3P imaging and 100 mW or 200 mW for 2P imaging) and saturation constraint (20%). Other parameters used are as follows: for 2P imaging: GM, , , nm, , , NA=1, fs, , , , ; for 3P imaging: , , , nm, , , NA=1, fs, , , , . B was subsequently calculated from S using the SBR data. SBR values above were set to to account for the finite dynamic range of a real detector. (b) S and B can then be used to calculate . Note that in the Gaussian case . The upper limit for the infinite sum in Eq. (15) was set to 2000. The accuracy of this was checked by computing the sum with the upper limit set to 3000, which showed little difference (see Fig. S2).

