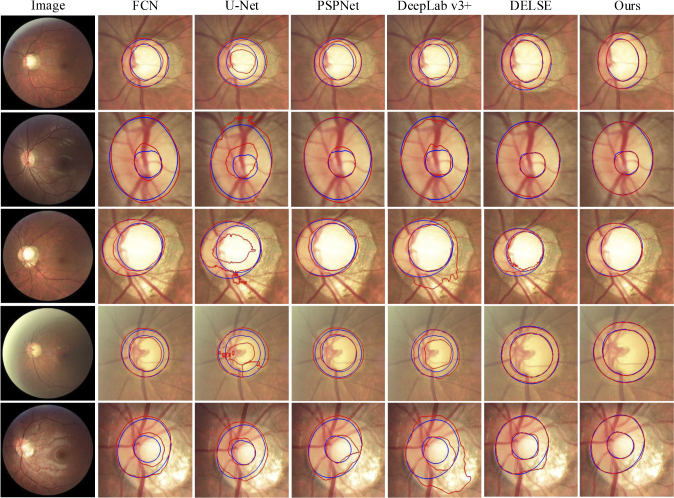
Fig. 9.
Segmentation result visualization of the optic cup (OC) and optic disc (OD), where the blue and red lines indicate the ground truth and the predictions of the proposed method. The first column shows five fundus image with different appearance and structure of OC and OD, including boundary blurring or structural changes. The rest of each column represents the segmentation results of different segmentation method.

