
Fig. 2.
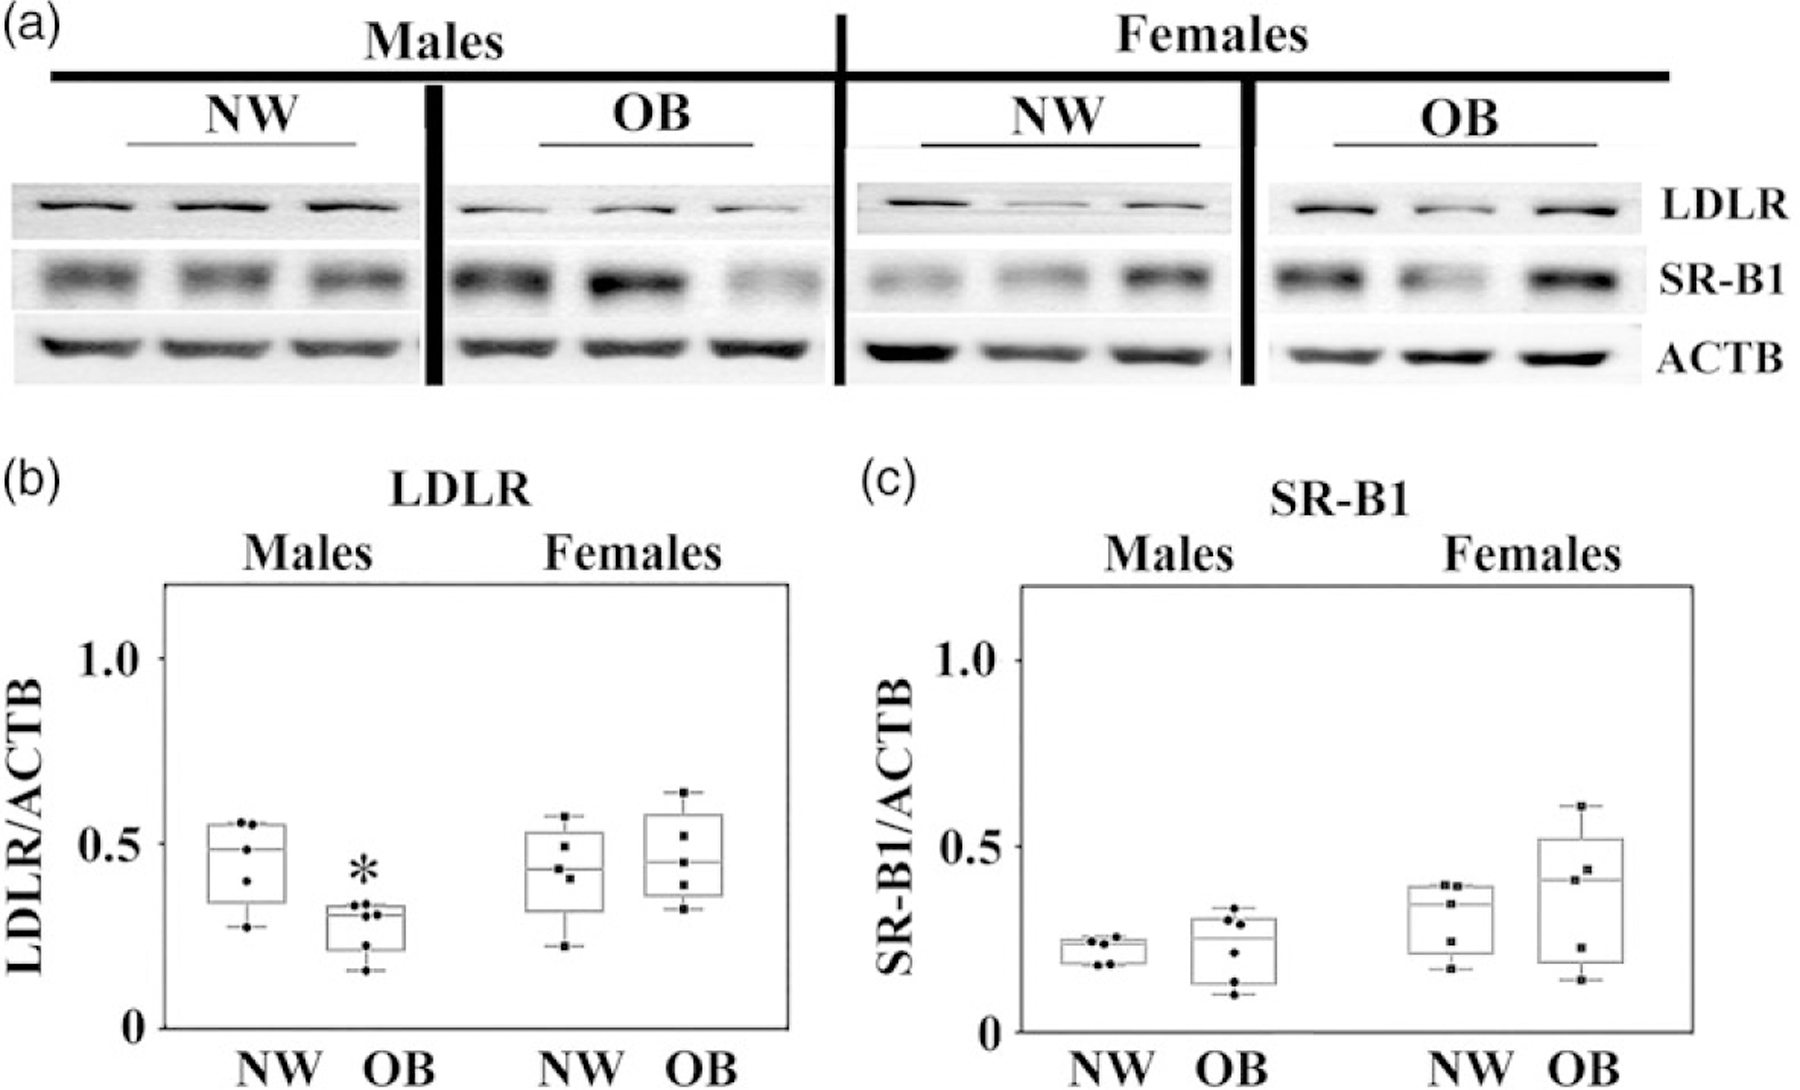
Expression of LDL and HDL (SR-B1) receptors in the placentas of NW and OB women. (a) Representative western blots; (b–c) quantification data for (b) LDL and (c) SR-B1. N = 6/group by BMI/sex.
*P < 0.05, NW versus OB.
Official websites use .gov
A
.gov website belongs to an official
government organization in the United States.
Secure .gov websites use HTTPS
A lock (
) or https:// means you've safely
connected to the .gov website. Share sensitive
information only on official, secure websites.
Expression of LDL and HDL (SR-B1) receptors in the placentas of NW and OB women. (a) Representative western blots; (b–c) quantification data for (b) LDL and (c) SR-B1. N = 6/group by BMI/sex.
*P < 0.05, NW versus OB.