
Fig. 2:
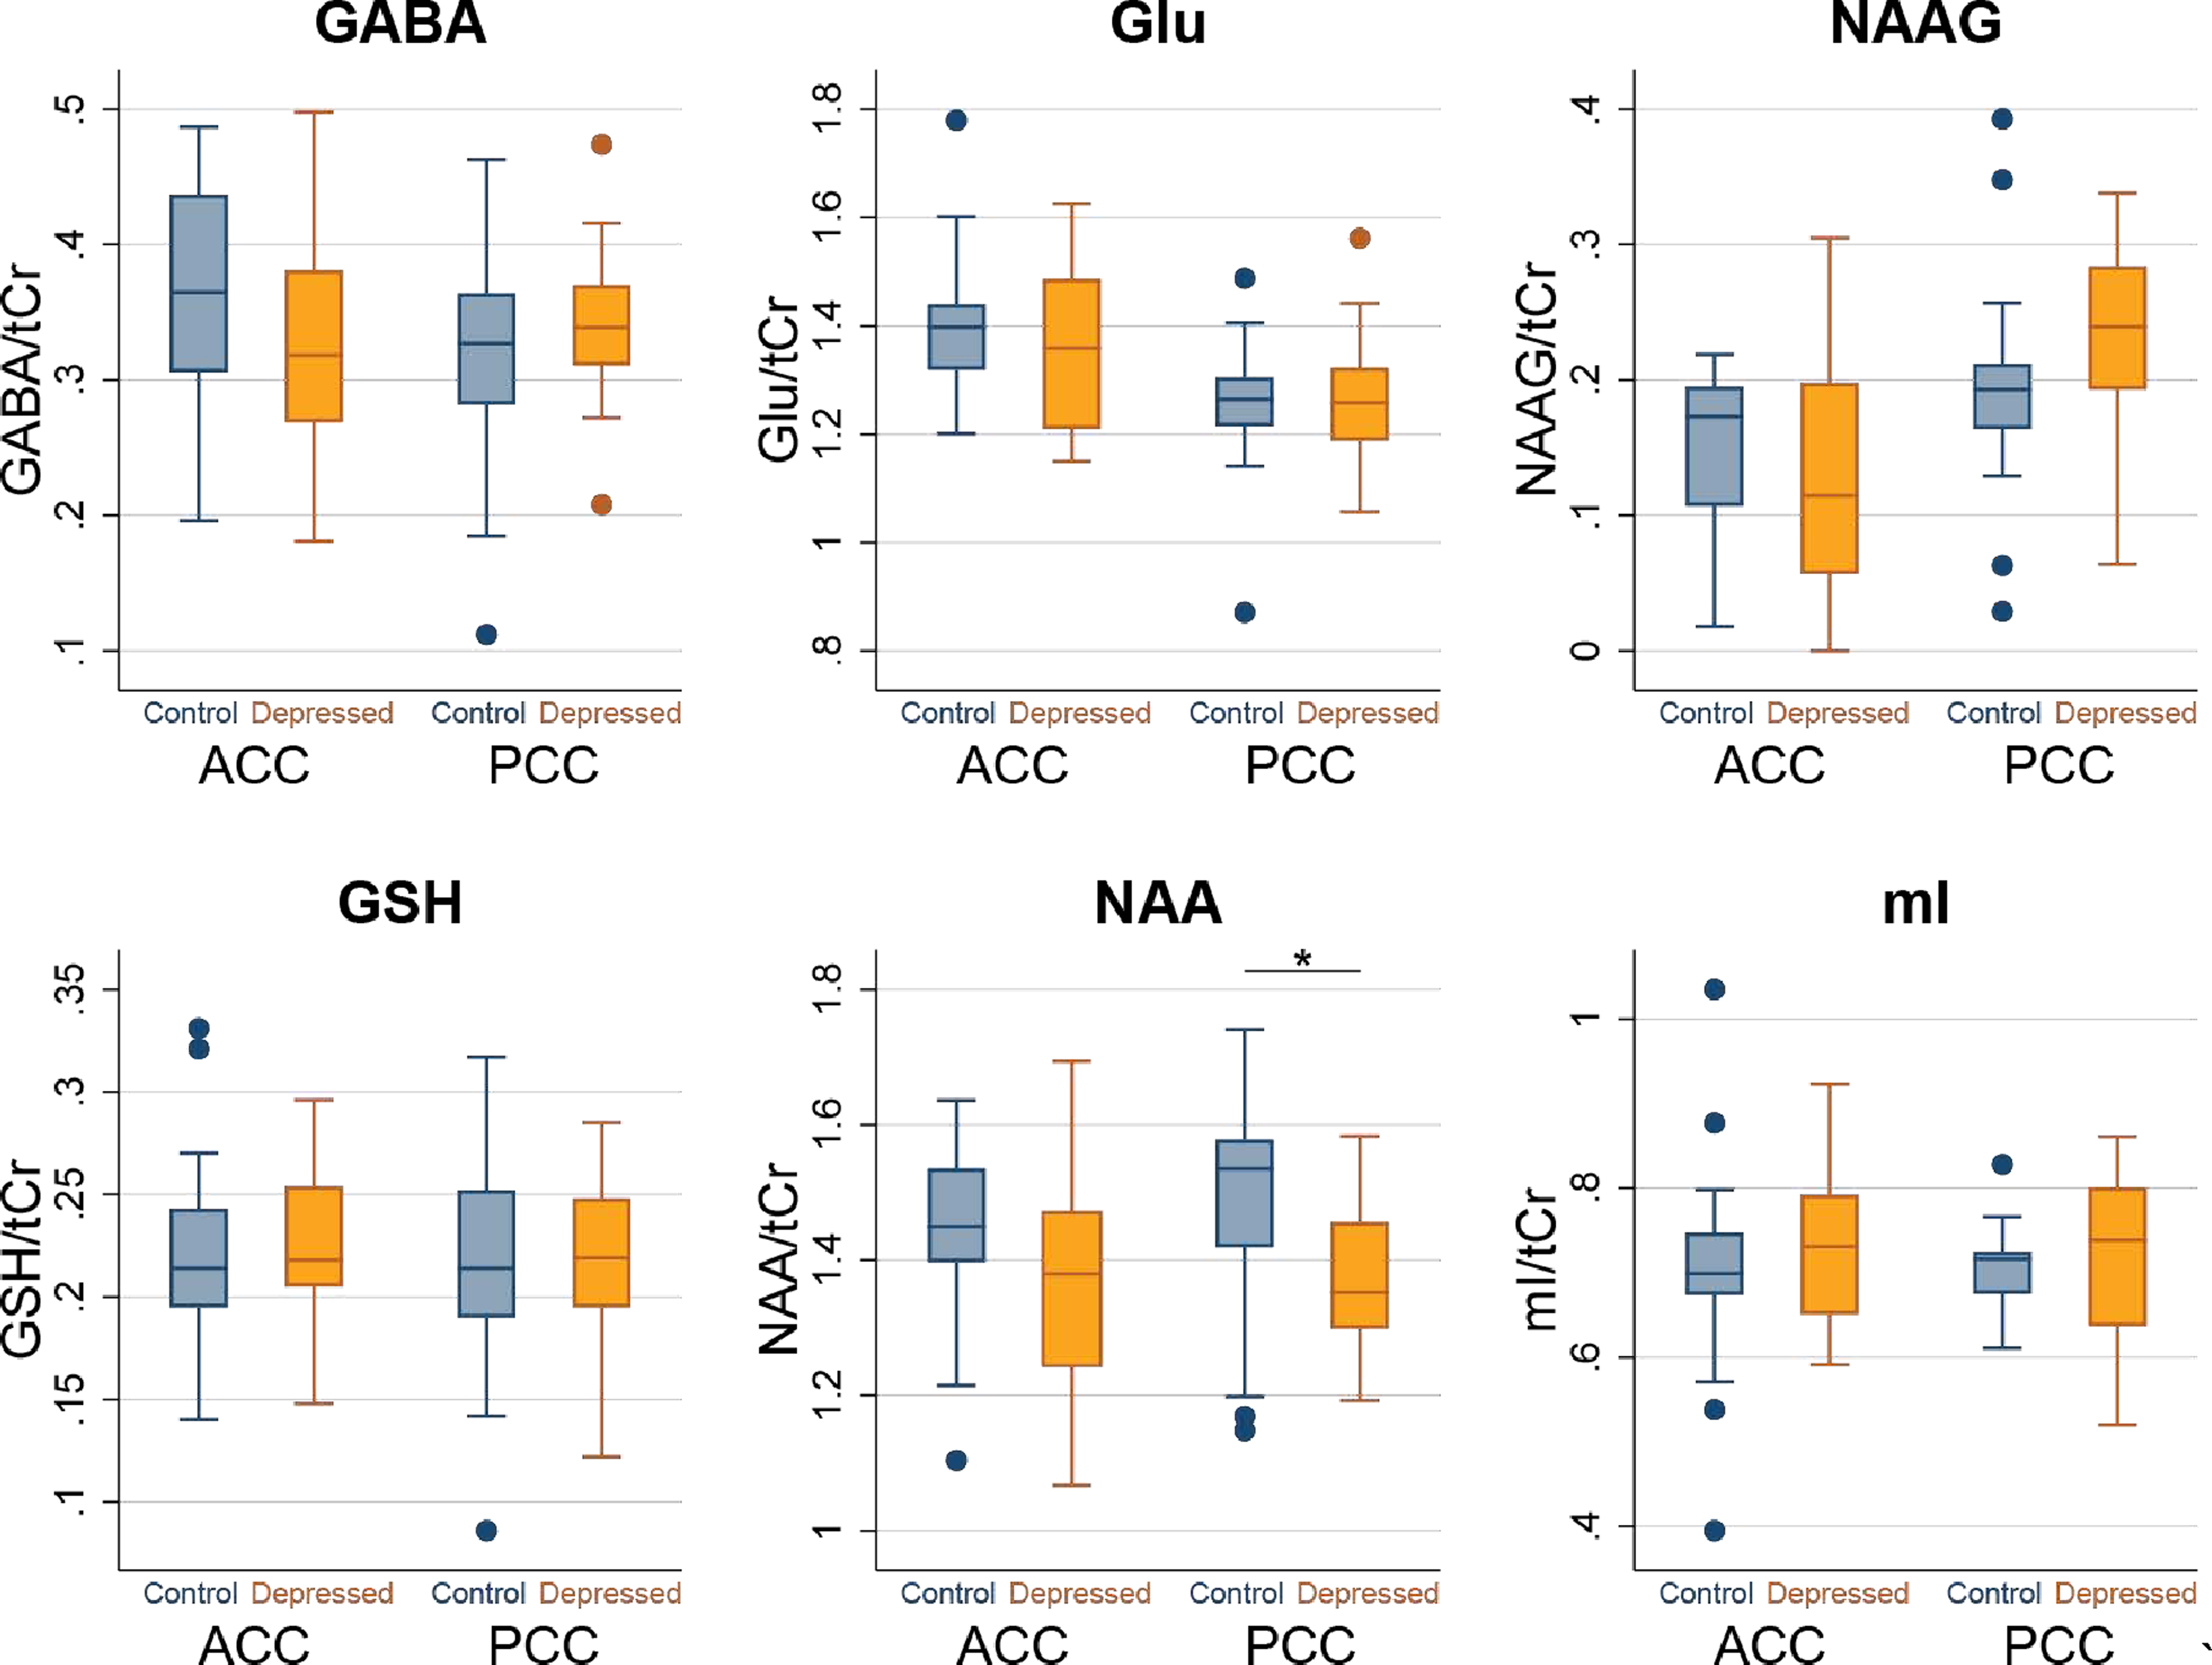
Box plots of metabolite levels at baseline from the ACC and PCC in LLD patients and Comparison Healthy Elderly Subjects. Dots represent outliers.
Official websites use .gov
A
.gov website belongs to an official
government organization in the United States.
Secure .gov websites use HTTPS
A lock (
) or https:// means you've safely
connected to the .gov website. Share sensitive
information only on official, secure websites.
Box plots of metabolite levels at baseline from the ACC and PCC in LLD patients and Comparison Healthy Elderly Subjects. Dots represent outliers.