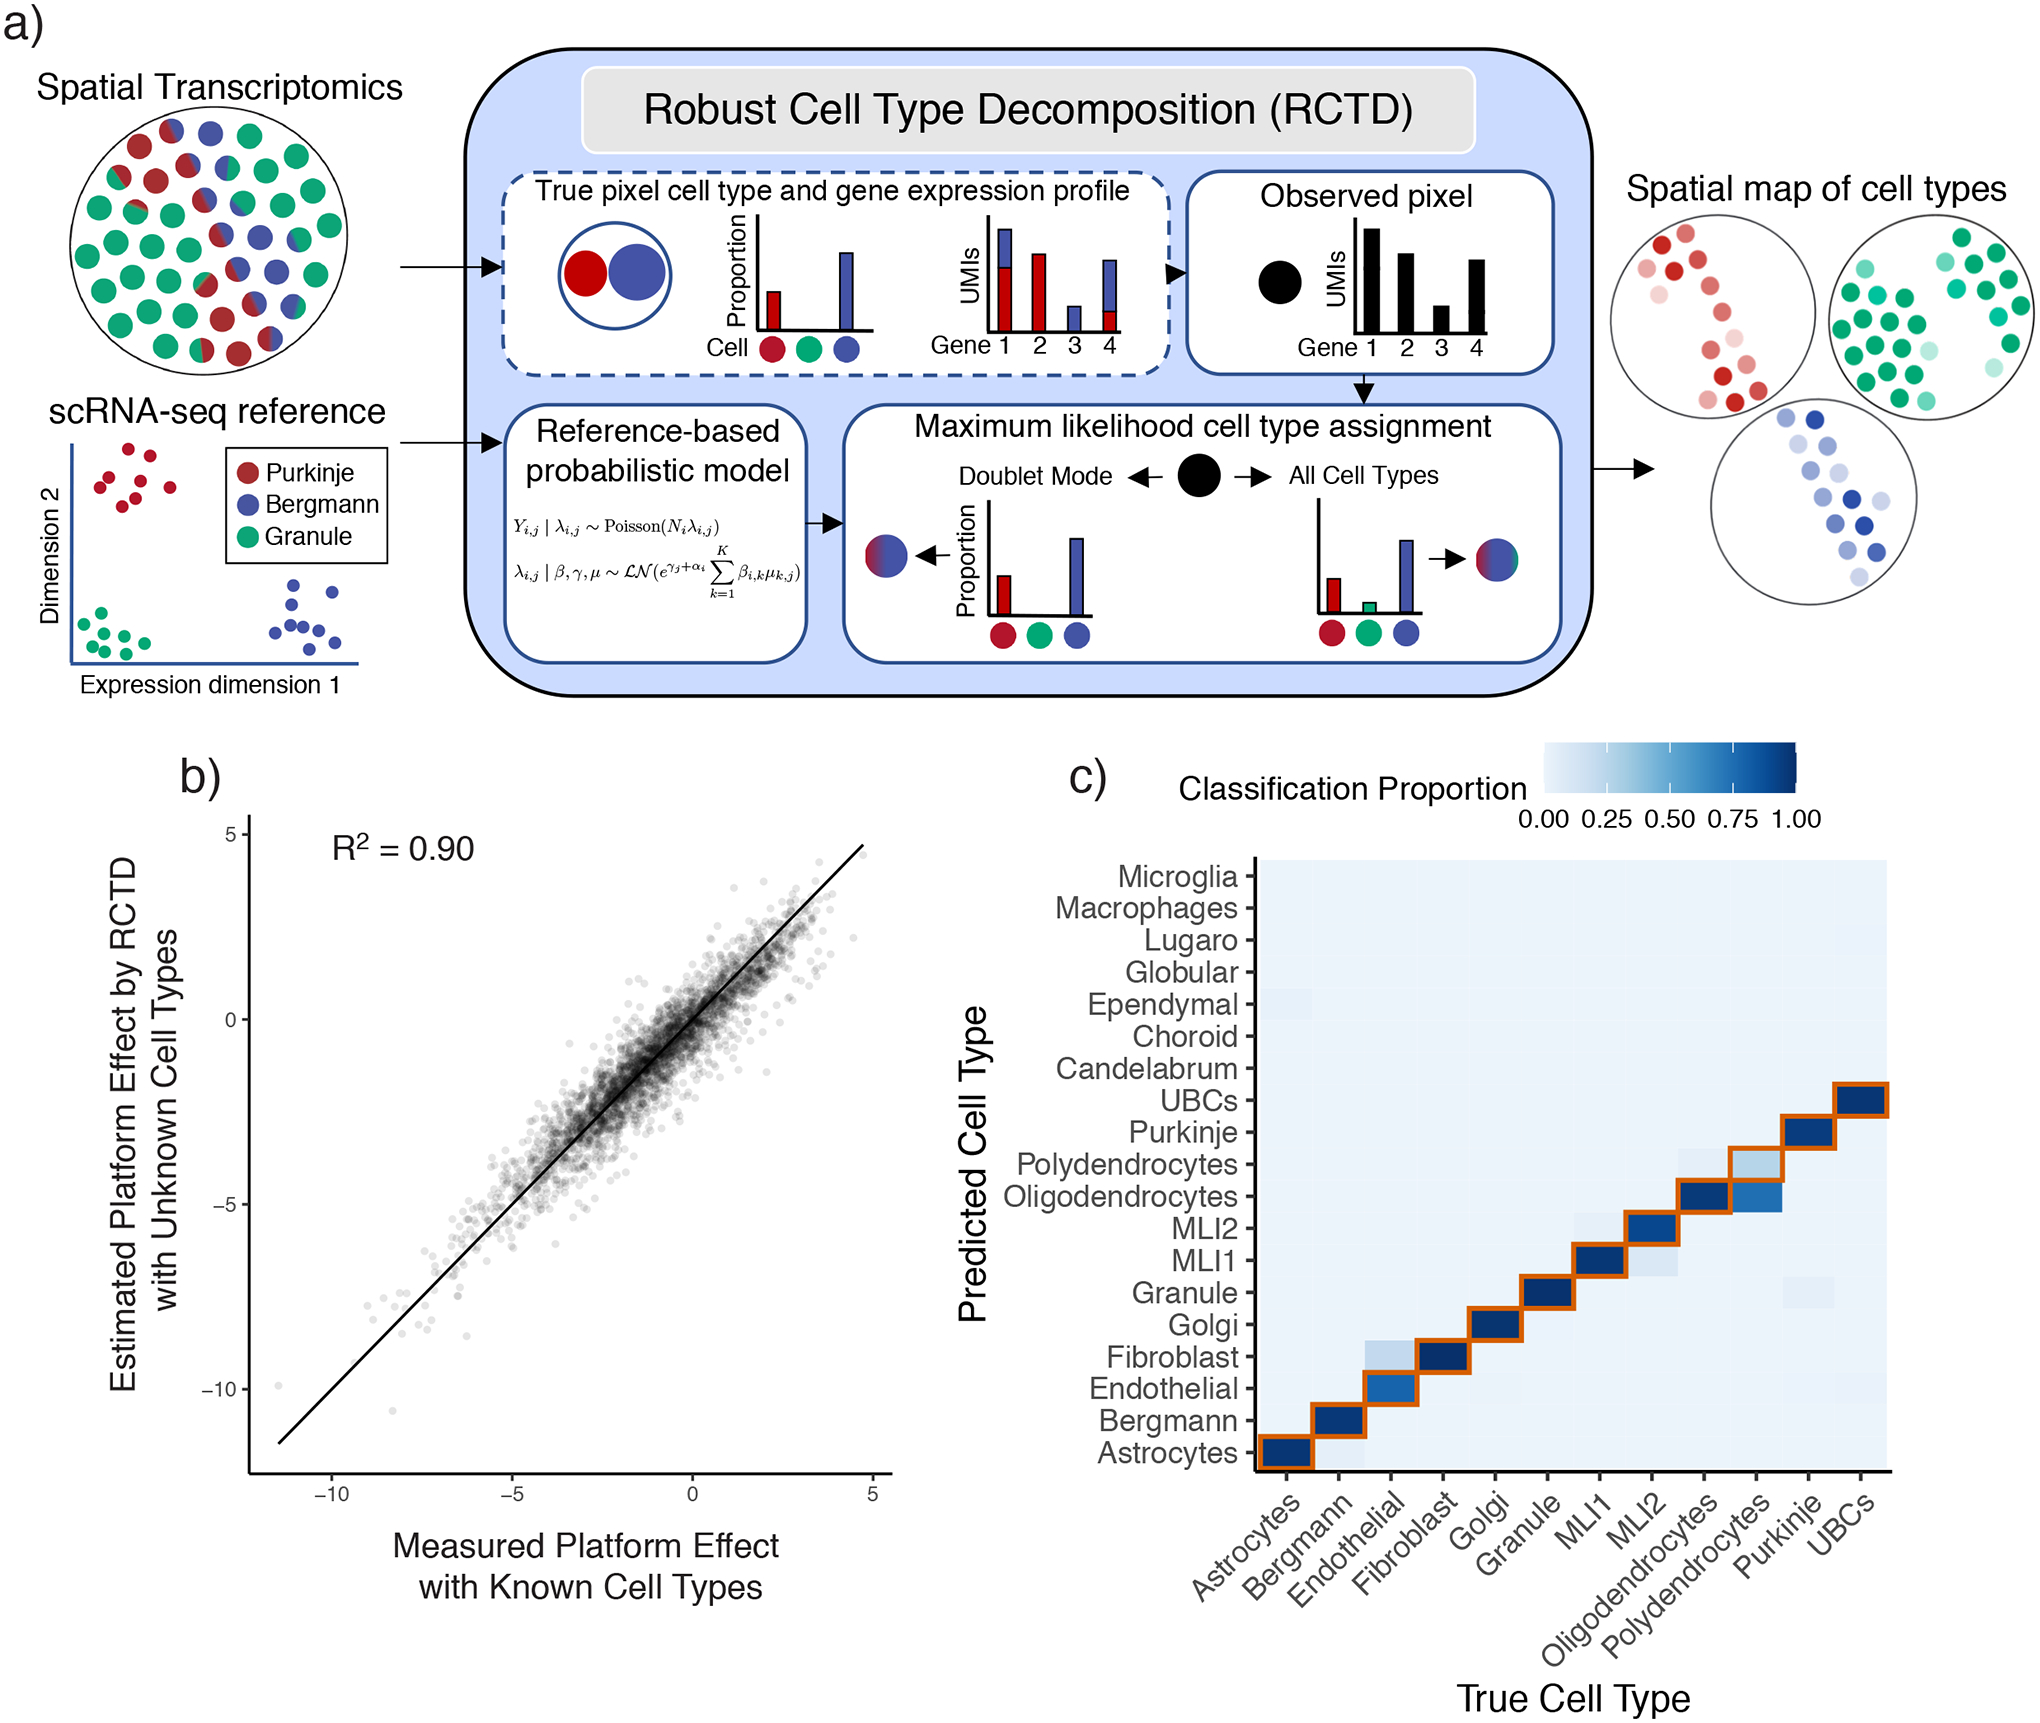
Figure 2:

Robust Cell Type Decomposition enables cross-platform learning of cell types.
a) Left: RCTD inputs: a scRNA-seq dataset, annotated by cell type, and a spatial transcriptomics dataset with unknown cell types. Middle: RCTD uses a scRNA-seq reference-based probabilistic model to predict cell types on a single pixel containing a mixture of two cell types (e.g. Bergmann/Purkinje), with unknown cell type proportions. RCTD predicts the maximum likelihood cell type proportions. In doublet mode, RCTD constrains each pixel to contain at most two cell types; alternatively, RCTD can estimate the best fit at a pixel using all cell types. Right: RCTD outputs a spatial map of cell types, with opacity representing the inferred cell type proportion.
b) Scatter plot of measured vs predicted platform effect (by RCTD) for each gene between the single-cell and single-nucleus cerebellum datasets. Line is the identity line. Measured platform effect is calculated as the log2 ratio of average gene expression between platforms.
c) Confusion matrix for RCTD’s performance on cross-platform (trained on single-nucleus RNA-seq, tested on single-cell RNA-seq) cell type assignments for single cells. Color represents the proportion of the cell type on the x-axis classified as the cell type on the y-axis. The diagonal representing ground truth is boxed in red.
