Figure 5:

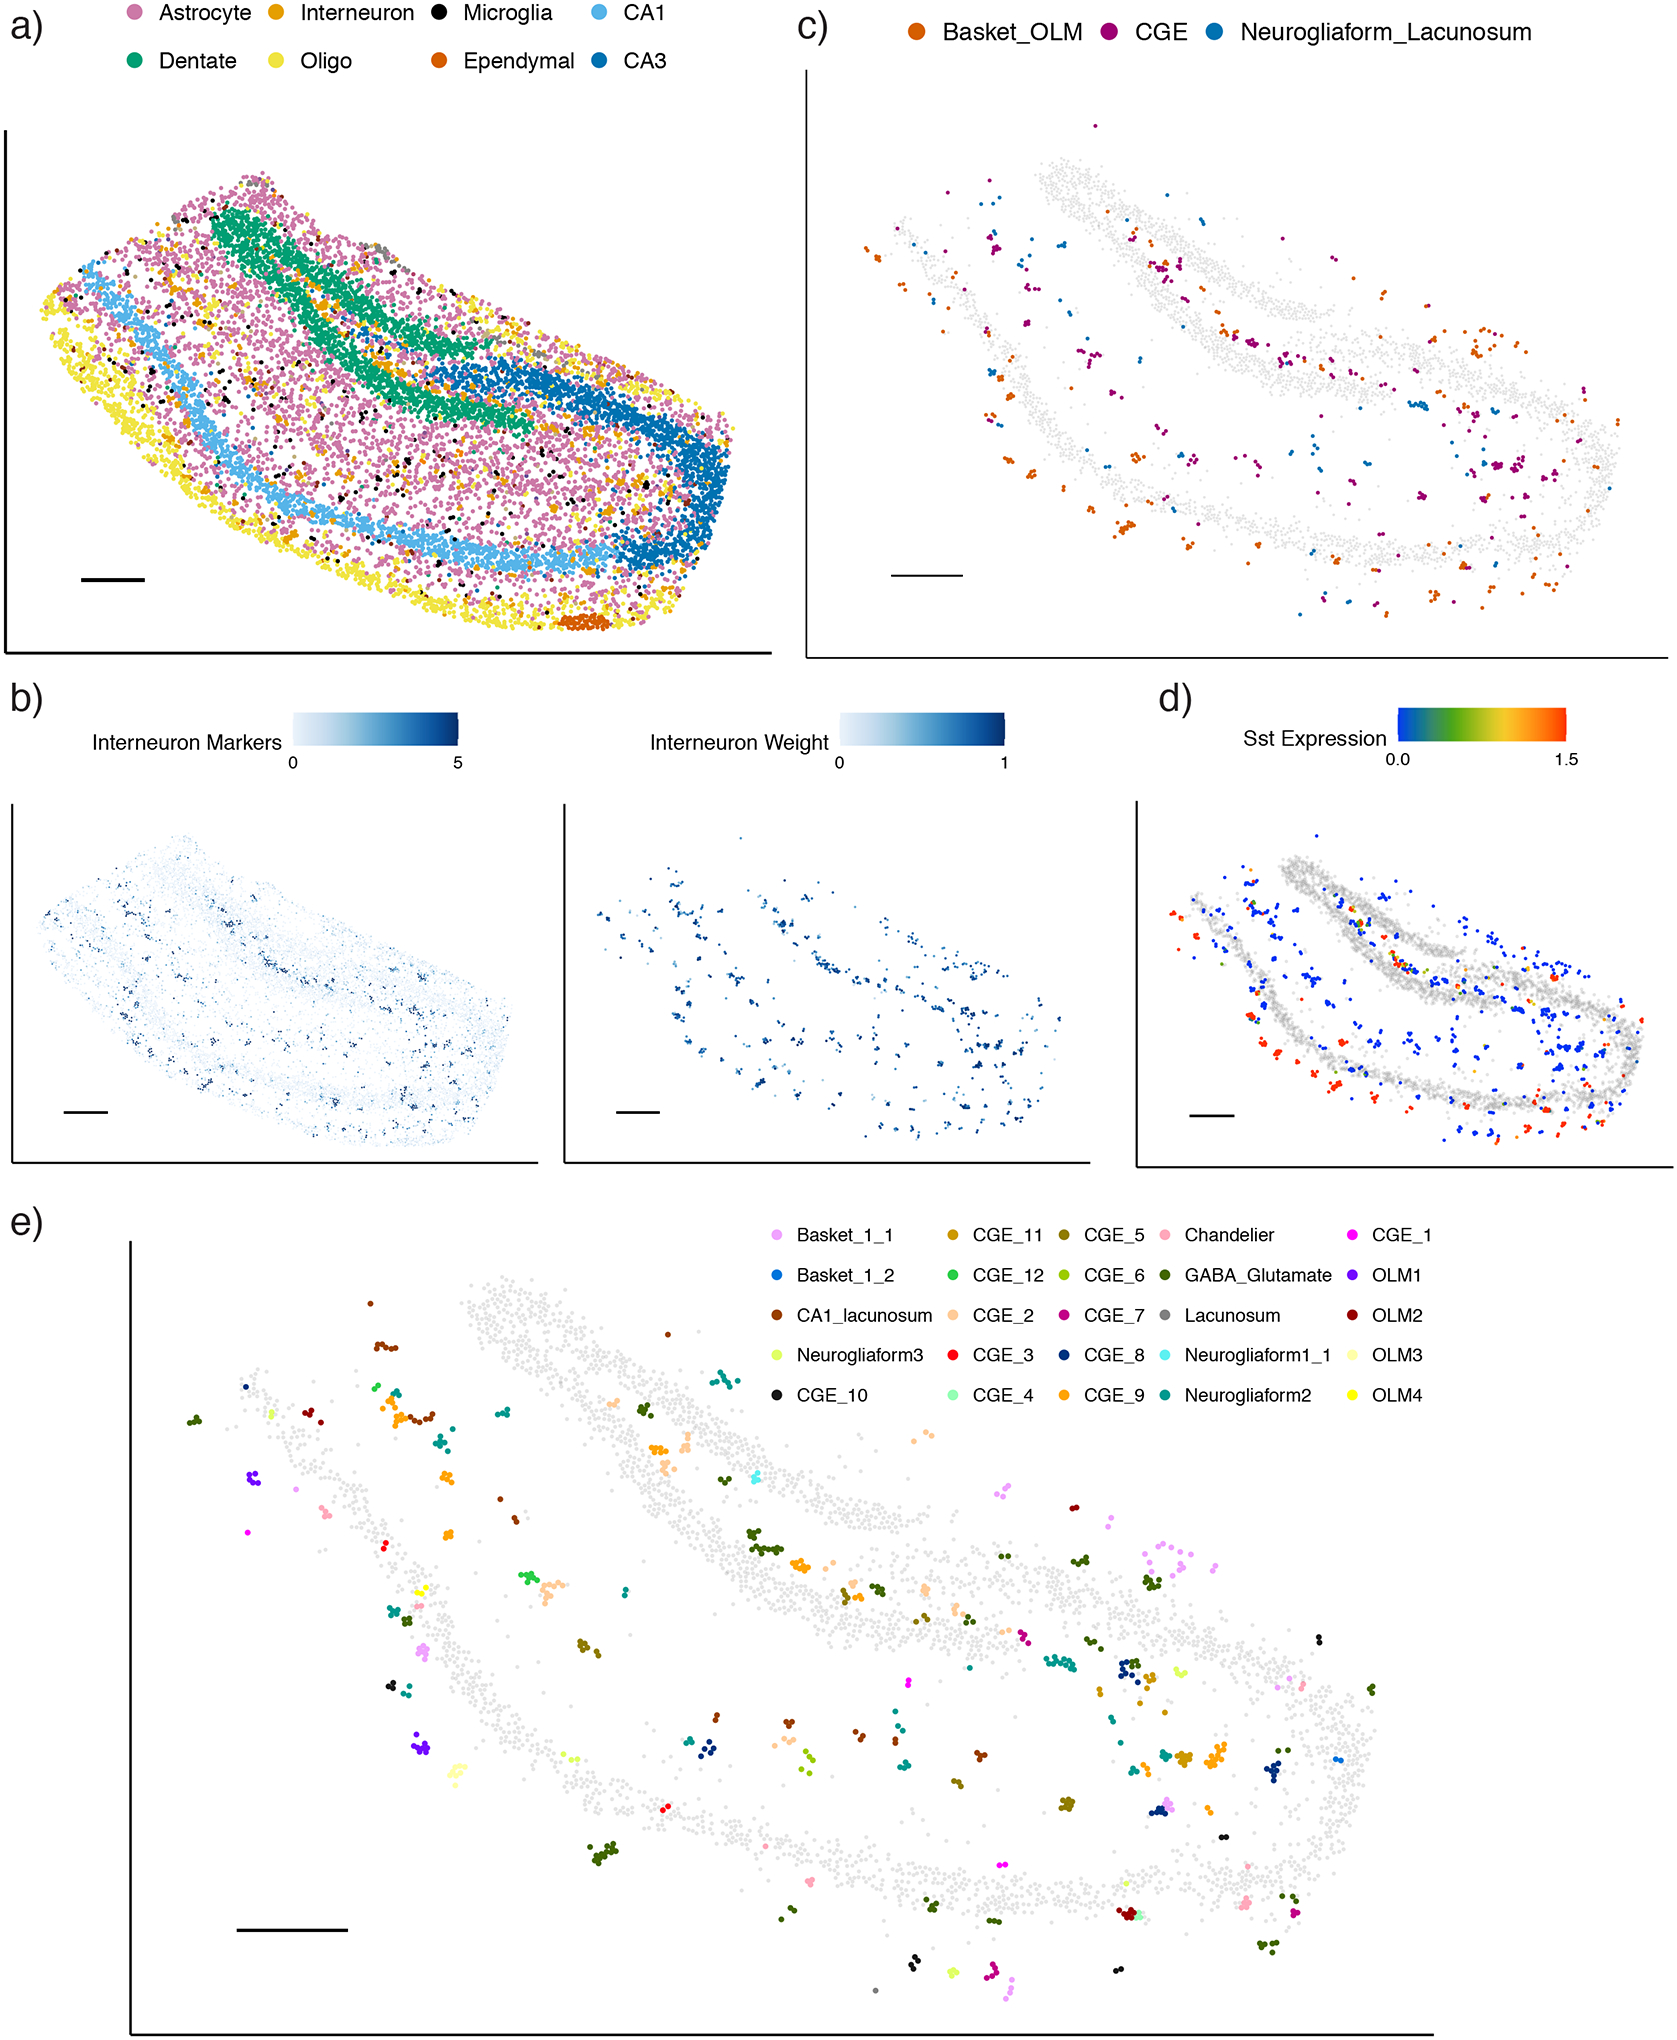
RCTD maps cell types and subtypes in Slide-seq hippocampus.
a) RCTD’s spatial map of predicted cell types in the hippocampus. Out of 17 cell types, the 8 most common appear in the legend (individual cell types displayed in Supplementary Figure 19).
b) Predicted spatial localization of interneuron cell types by RCTD. Left: normalized expression (represented by color, counts per 500) of marker genes. Right: predicted spatial locations of interneurons, with color representing predicted cell type proportion.
c) Predicted confident assignments of interneuron pixels by RCTD to 3 classes of interneuron subtypes, plotted in space. Color indicates predicted subclass.
d) Expression (counts per 500) of the Sst gene in interneurons identified by RCTD.
e) RCTD’s confident assignment of spatial clusters to 27 interneuron subtypes (25/27 subtypes assigned).
All scale bars 250 microns. Grey circles represent location of CA1, CA3, and dentate gyrus excitatory neurons for reference.
