
FIGURE 2.
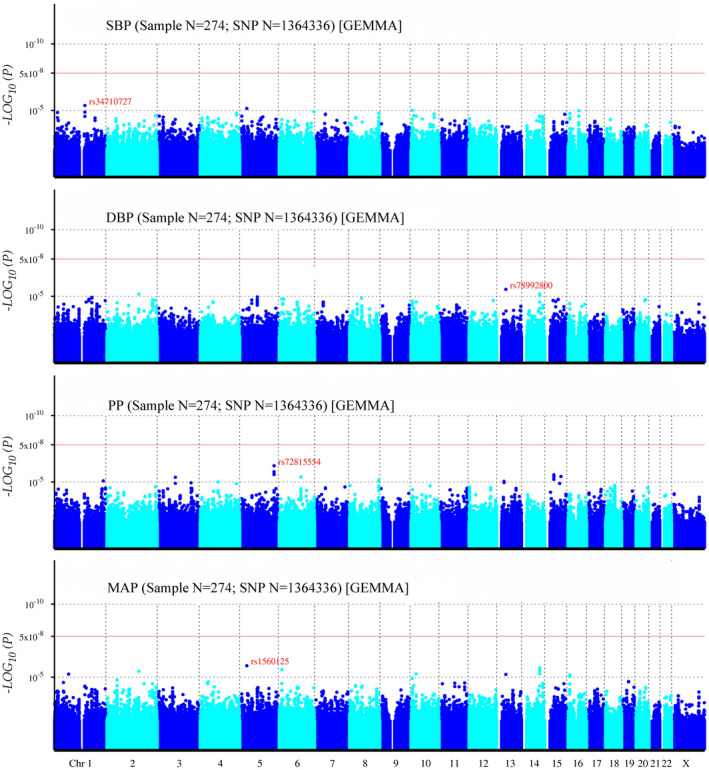
Manhattan plot for genome‐wide association study of SBP, DBP, PP, and MAP. The x‐axis shows the numbers of autosomes and the X chromosome, and the y‐axis shows the p‐values for statistical significance. The dots represent the SNPs. None of the SNPs reached the genome‐wide significance level (p < 5 × 10⁻⁸)