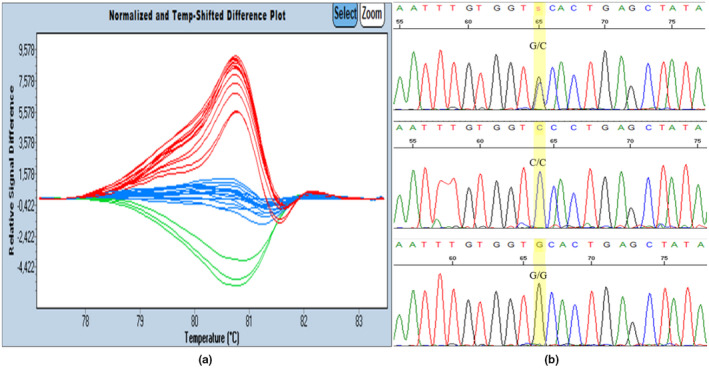
FIGURE 2.

High resolution melting Difference plots and nucleotide sequencing chromatograms showing the HLA‐G +3142C/G polymorphism. (a) Normalized difference curves of HLA‐G target sequence. Blue curves: C/C samples, red curves: C/G samples, green curves: G/G samples. (b) Nucleotide sequencing chromatograms showing the HLAG +3142C/G polymorphism
