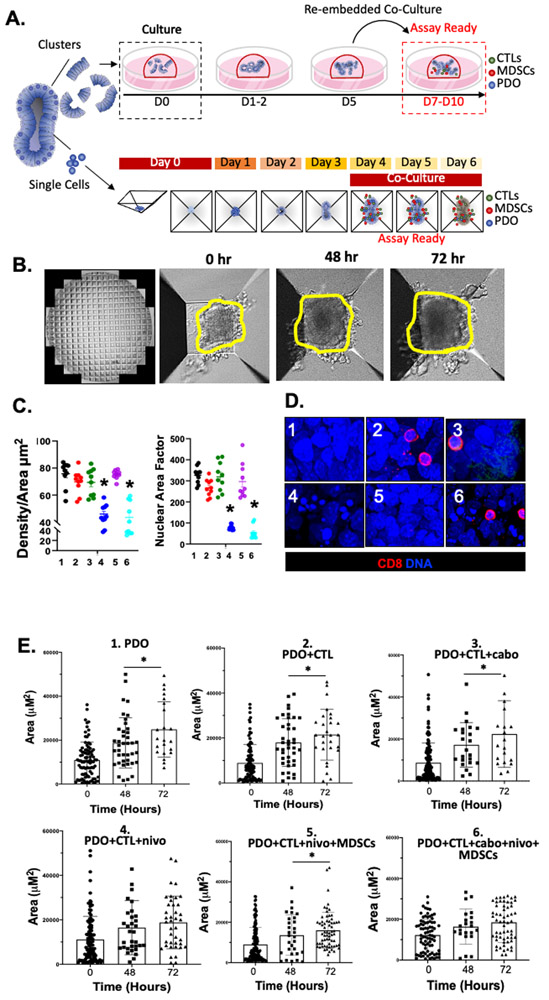
Figure 3: Morphological changes in PD-L1+ PDO/immune cell co-cultures in response to nivolumab.
(A) Schematic diagram showing the generation and timeline of organoid/immune cell co-culture using either Matrigel® dome or AggreWell™ microwell plates. (B) Representative images of morphological changes of PDO/immune cell co-cultures after 0, 48 and 72 hours of treatment in AggreWell™ microplates (yellow outlining indicates increased organoid area. (C) Changes in Density/Area (μm2) and nuclear area factor 72 hours after treatment in conditions 1 - 6. (D) Immunofluorescence showing expression of CD8+ cells (red) and nuclei stained by DAPI 72 hours after treatment in conditions 1 – 6. (E) Change in organoid Area ((μm2) in vehicle (condition 1) in co-cultures with CTLs (condition 2), cabozantinib (condition 3) or nivolumab (condition 4) in co-cultures with CTLs, nivolumab (condition 5) or a combination of nivolumab and cabozantinib (condition 6) in co-cultures with CTLs and MDSCs at 0, 48 and 72 hours. *p<0.05 compared to 0hr/vehicle treated for each condition besides condition 4 and 6 (ns= nonsignificant), n = 4 organoid co-cultures derived from individual patients.

