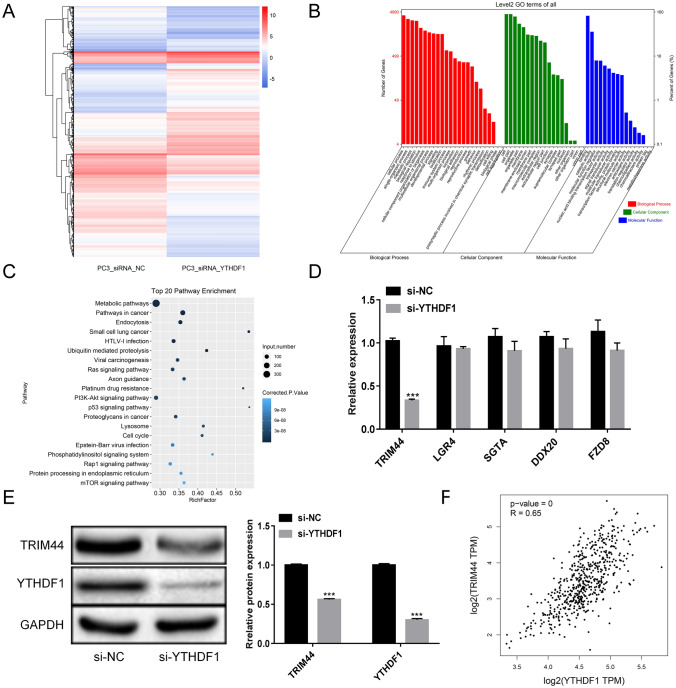
Fig. 3.
YTHDF1 regulatory mechanism in prostate cancer as analyzed by mRNA sequencing. A Analysis of mRNA differential expression in PC3_siRNA_NC and PC3_siRNA_YTHDF1 groups. B GO analysis. C KEGG analysis. D The levels of TRIM44, LGR4, SGTA, DDX20, and FZD8 were measured by qRT-PCR. E Western blotting detection of TRIM44 and YTHDF1 levels. F The correlation between YTHDF1 and TRIM44. Scale bar 50 μm, the magnification is 200 times. *P < 0.05, **P < 0.005, ***P < 0.001

