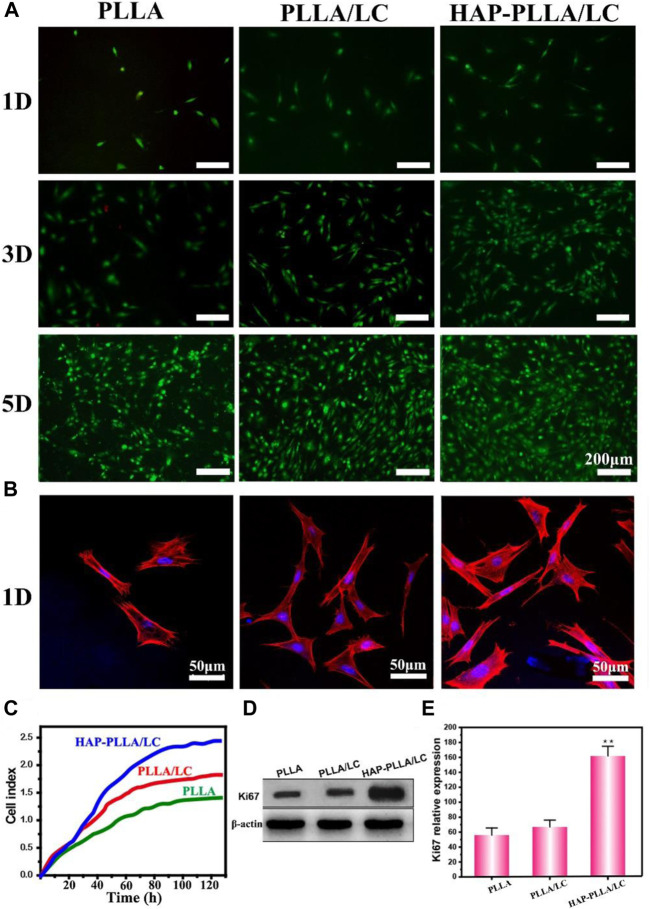
FIGURE 5.
(A) Images of live/dead fluorescent staining of BMSCs cells on the PLLA, PLLA/LC, and HAP-PLLA/LC composites after culturing for 1, 3, and 5 days. (B) CLSM micrographs of BMSCs stained with rhodamine-conjugated phalloidin (red) and 4, 6-diamidino-2-phenylindole (DAPI) (blue) were cultured on the PLLA, PLLA/LC, and HAP- PLLA/LC composites for 1 day. (C) The cell growth curve of BMSCs. (D,E) The results of Ki67 protein expression on day 5 (*p < 0.05 and **p < 0.01).

