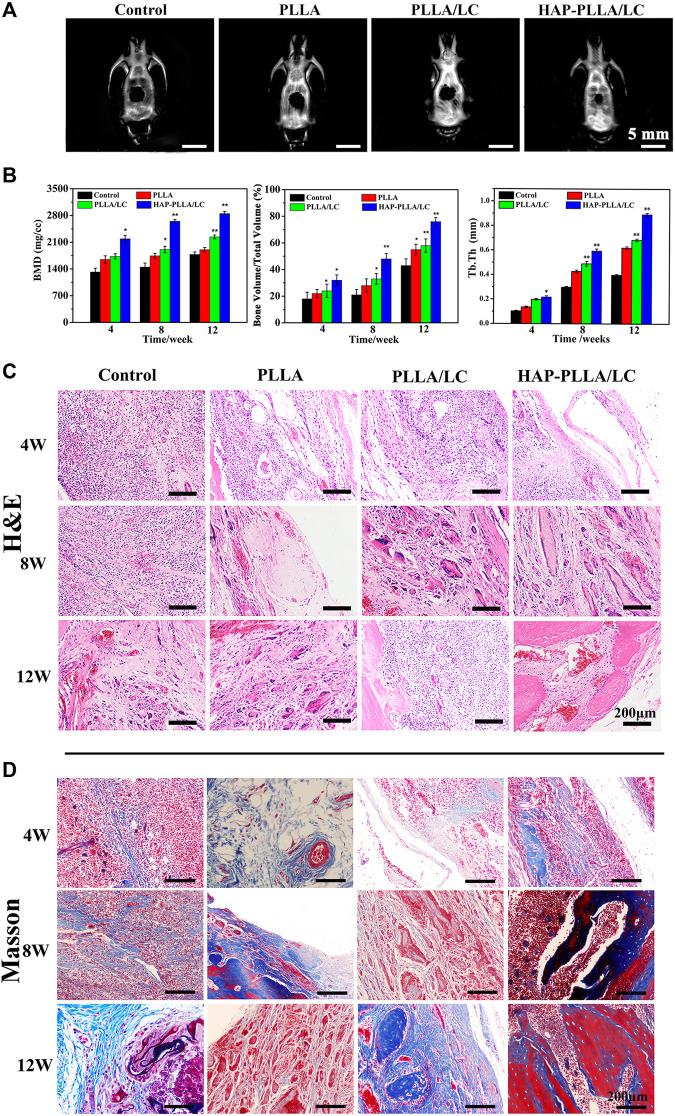
FIGURE 7.
(A) Micro-CT results of bone defect of 12 weeks after surgery; (B) quantitative analysis of bone mineral density (BMD), the bone volume/total volume fraction (BV/TV), and trabecular thickness (Tb.Th). (C) Hematoxylin and eosin (H&E) staining and (D) Masson’s staining of samples (including control, PLLA, PLLA/LC, and HAP-PLLA/LC filled areas at 4, 8, and 12 weeks of postimplantation.

