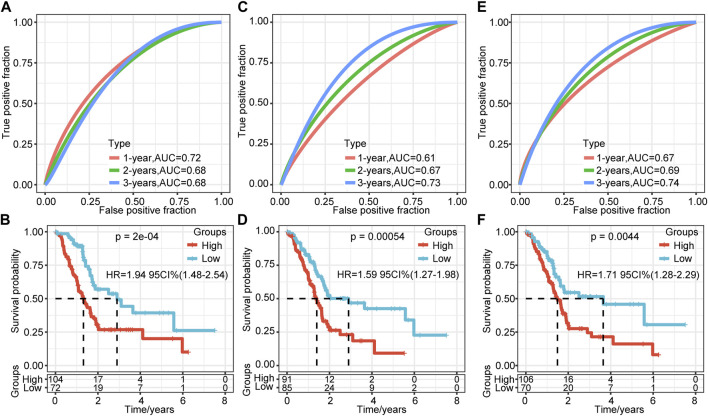
FIGURE 8.
Comparison of the risk model and existing model. (A–B) ROC of seven-gene signature (Cheng) risk model and KM curve of high/low RiskTypes (Cheng). (C–D) ROC of the six-gene signature (Stratford) risk model and KM curve of high/low RiskTypes. (E–F) ROC of the nine-gene signature (Xu) risk model and KM curve of high/low RiskTypes.

