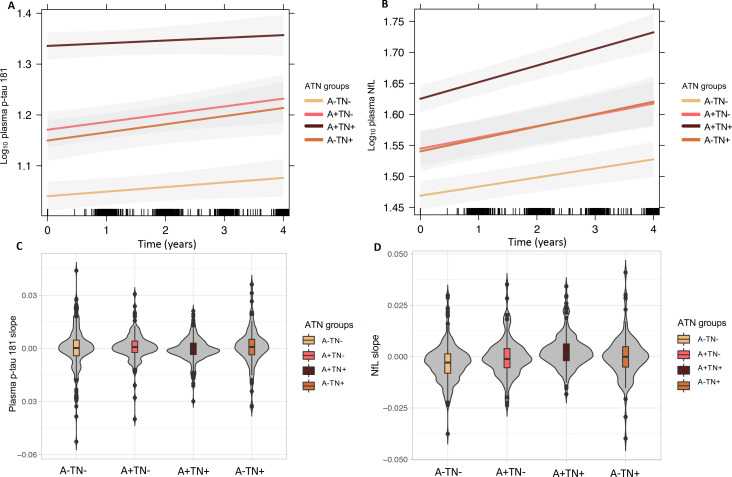
Figure 1.
Longitudinal trajectories of plasma p-Tau181 and plasma NfL concentrations in the different ATN groups (A) log10 plasma p-Tau181 (B) log10 plasma NFL. Rate of change over time (slope) obtained using a LMEM (C) plasma p-Tau181 (normalised) and (D) plasma NfL concentrations (normalised) comparing the ATN groups. A+/−, amyloid-β positive/negative; ATN, Aβ deposition, tau pathology and neurodegeneration; LMEM, linear mixed effects model; NfL, neurofilament light protein, picogram per millilitre; p-Tau181, tau phosphorylated at threonine 181; TN+/−, tau/neurodegeneration.

