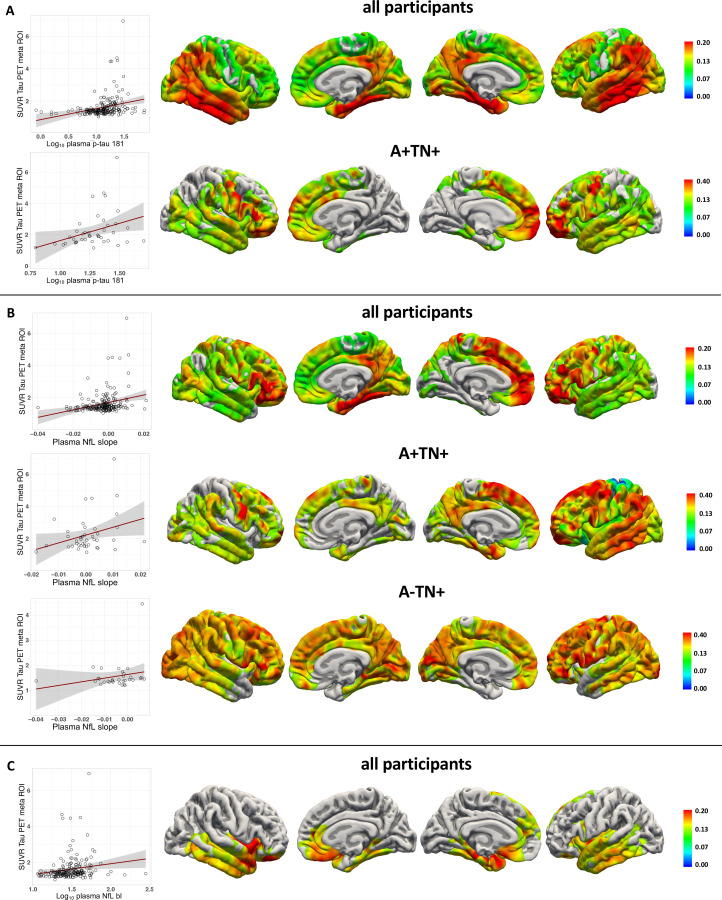
Figure 3.
Association of plasma biomarkers with flortaucipir uptake after approximately 5 years time. (A) Log10 plasma p-Tau181 (B) plasma NfL rate of change (slope) (C) log10 plasma NfL baseline in the whole study cohort and within the ATN groups. Left: linear regression between biomarker and SUVR PET uptake in a meta ROI*. Right: Vertex-wise Pearson correlations adjusted for age, sex and the time difference between plasma sampling and flortaucipir PET (tfce FWE corrected p<0.05). AV45, 18F-florbetapir amyloid-β PET. *Flortaucipir meta ROI: entorhinal, amygdala, parahippocampal, fusiform, inferior temporal and middle-temporal-ROIs. A+/−, Aβ positive/negative; ATN, Aβ deposition, tau pathology and neurodegeneration; FWE, family-wise error corrected; NfL, neurofilament light chain; p-Tau181, tau phosphorylated at threonine 181; ROI, region of interest; SUVR, standardised uptake value; tfce, threshold free cluster enhancement; TN+/−, Tau/Neurodegeneration.

