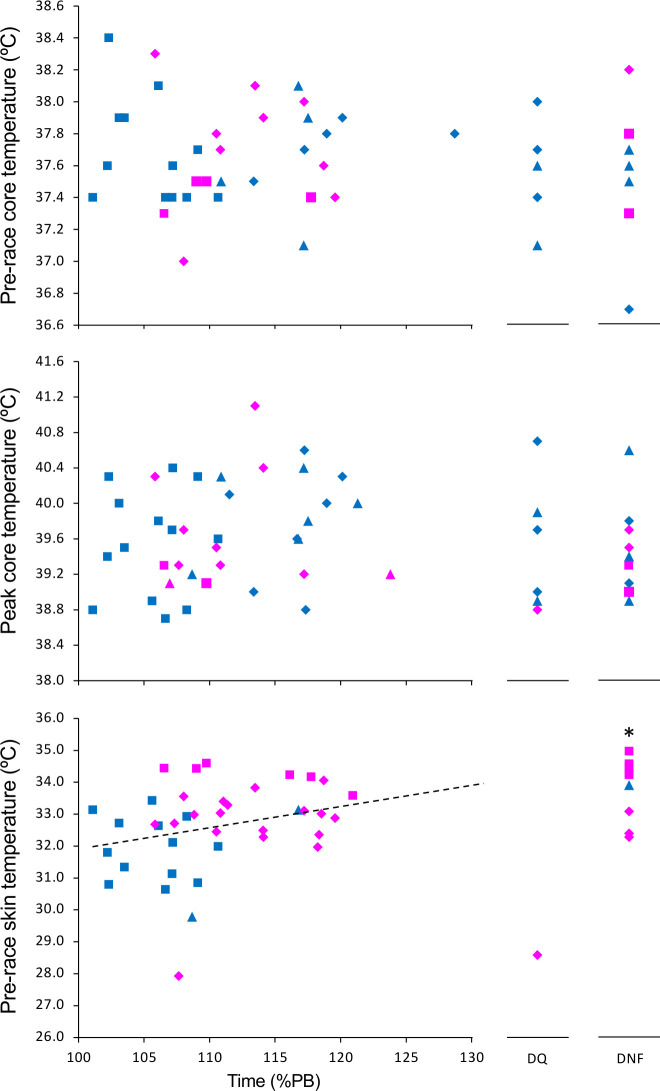
Figure 3.
Core and skin temperature in finishers, disqualified and did not finish (DNF). Pre-race skin temperature was correlated to the relative finishing time (in % if personal best, r=0.32, p=0.046). DNF had a higher pre-race skin temperature than finishers (*p=0.017). Square, diamond and triangle represent marathon, 20 km and 50 km race-walks, respectively. Blue and pink symbols represent men and women, respectively. %PB, percentage of personal best.

