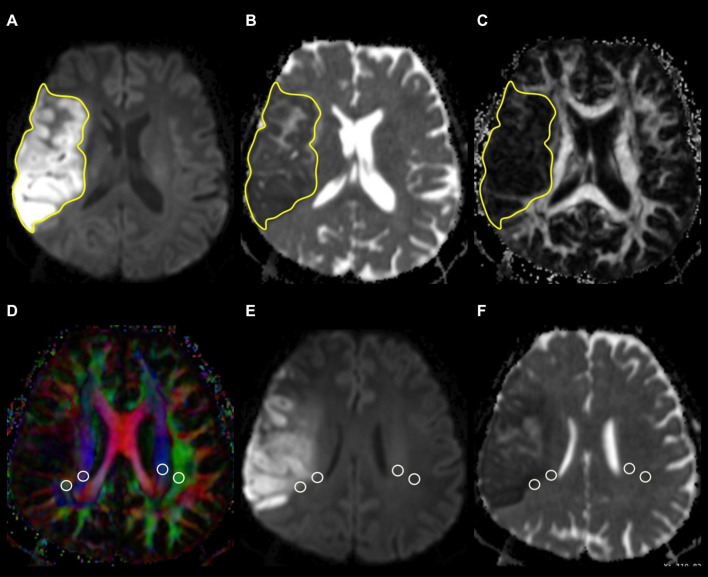
FIGURE 1.
Example of how regions of interest (ROIs) were segmented. Transverse isotropic diffusion-weighted (A), apparent diffusion coefficient (B), and fractional anisotropy images show manually drawn ROIs for measurement of infarct volume, ADC, and FA values. Directionally encoded color map (D) illustrates ROIs of projection (blue area) and association (green area) fibers in bilateral periventricular regions. On the co-registered isotropic diffusion-weighted (E) and apparent diffusion coefficient (F) images, these ROIs do not include infarcted tissue.

