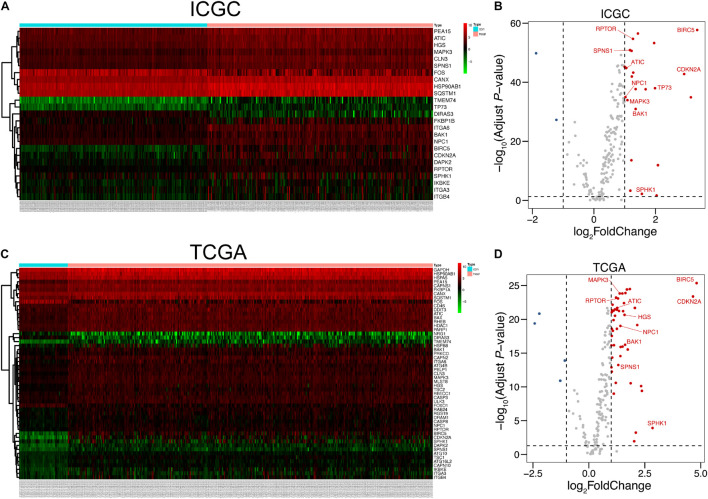
FIGURE 2.
Autophagy-related DEGs of HCC in ICGC and TCGA. (A,C) Heat maps of DEGs in ICGC and TCGA. The number of normal tissues was 202, and the number of tumor tissues was 243, all retrieved from ICGC. As for TCGA, the number of normal samples was 50 and that of tumor samples was 374. (B,D) Volcano plots of DEGs in the ICGC and TCGA databases. Ten hub genes studied in our research were labeled in the corresponding position. The detailed analytic information of the autophagy-related genes is presented in Supplementary Tables 1, 2.

