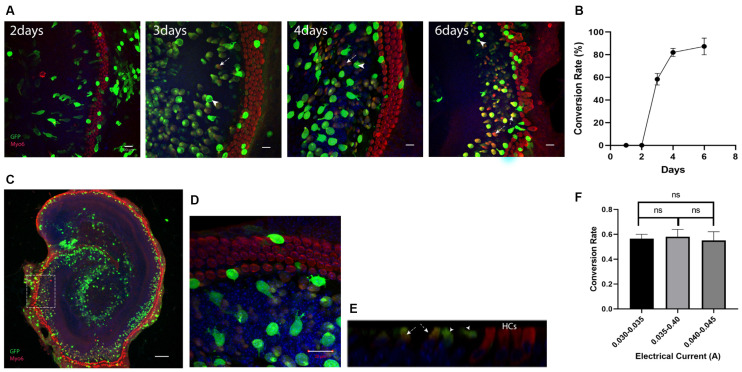
Figure 2.
Ectopic expression of Atoh1 leads to the new Myosin6 expressing cells in lateral GER. (A) Morphological images of Atho1-eGFP plasmids transfected explants at 2, 3, 4, and 6 days after the electroporation. The image for 6th day is an enlarged image of the white square in panel (C). GFP+ cells indicate the transfected cells and GFP+/Myo6+ cells in lateral GER indicate the Myo6 expressing cHCs after the ectopic expression of Atoh1. There were no cHCs 2 days after the electroporation, more cHCs were observed from day 3 to day 6 , and the transfected cells were gradually getting closer to endogenous HCs. (B) The percentage of GFP+/Myo6+ cells vs. all GFP+ cells in lateral GER (conversion rate) gradually increases from day 2 to day 10 after the electroporation. (C) Typical Atoh1-eGFP plasmid transfected cochlear explant showing most of the transfected cells were localized in the lateral GER, Scale bar = 100 μm. High-resolution image (D) and ortho image (E) showing the transfected epithelium cells. (F) The conversion rate of transfected cells with different electric currents. The arrows pointed to GFP single positive cells which are the transfected cells that failed to transdifferentiate, the arrowheads pointed to the GFP, Myosin6 double-positive cells which are the cHCs. Scale bar = 20 μm. ns, not significant by unpaired two-tailed Student’s t-test. Results are presented as the mean ± SEM.

