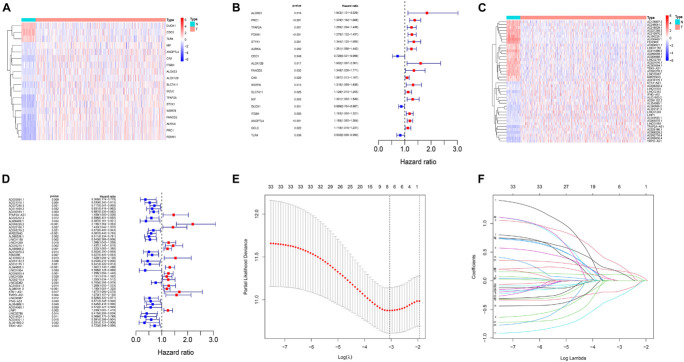
FIGURE 1.
Identification of ferroptosis-related lncRNAs in LUAD patients and construction of a prognostic signature. (A) Heatmap for 18 differentially expressed genes, with red indicating high expression and blue indicating low expression. (B) Forest map for 18 prognostic genes. (C) Heatmap for 33 differentially expressed lncRNAs, with red indicating high expression and blue indicating low expression. (D) Forest map for 33 prognostic lncRNAs. (E) The optimal log λ value is indicated by the vertical black line in the plot. (F) The LASSO coefficient profile of ferroptosis-related lncRNAs, each line represents an independent lncRNA.

