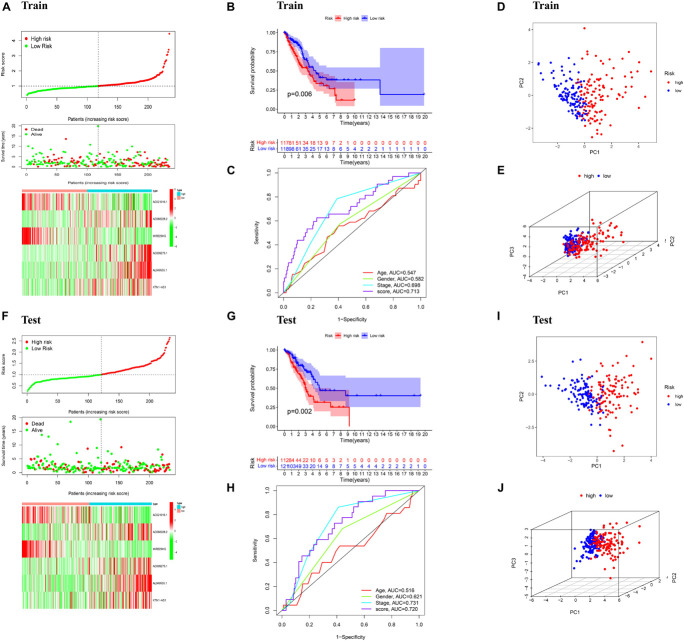
FIGURE 2.
Validation of the prognostic signature. (A) Distribution of ferroptosis-related lncRNAs model based on risk score for the training set, patterns of the survival time, and survival status between the high- and low-risk groups for the training set and clustering analysis heatmap shows the display levels of the six ferroptosis-related lncRNAs for each patient in the training set. (B) Kaplan–Meier survival curves of the OS of patients in the high- and low-risk cohorts for the training set. (C) Time-dependent ROC analysis of accuracy of the model in the training set. (D) 2D and (E) 3D plots of the PCA of the training set. (F) Distribution of ferroptosis-related lncRNAs model based on risk score for the testing set, patterns of the survival time, and survival status between the high- and low-risk groups for the testing set and clustering analysis heatmap shows the display levels of the six ferroptosis-related lncRNAs for each patient in the testing set. (G) Kaplan–Meier survival curves of the OS of patients in the high- and low-risk cohorts for the testing set. (H) Time-dependent ROC analysis of accuracy of the model in testing set. (I) 2D and (J) 3D plots of the PCA of the testing set.

