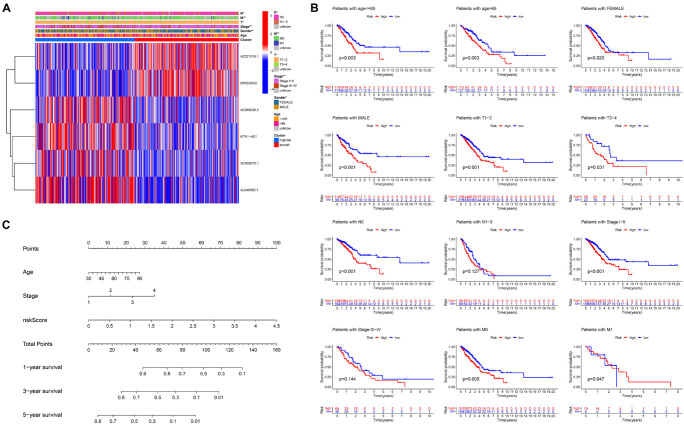
FIGURE 6.
Stratification analysis of the ferroptosis-LPS and construction of the ferroptosis-LPS-based nomogram. (A) Heatmap of clinicopathological features and risk score of each patient in the entire TCGA dataset. (B) Survival analysis in various subgroups. (C) The nomogram predicts the probability of the 1-, 3-, and 5-year OS.

