
FIGURE 11.
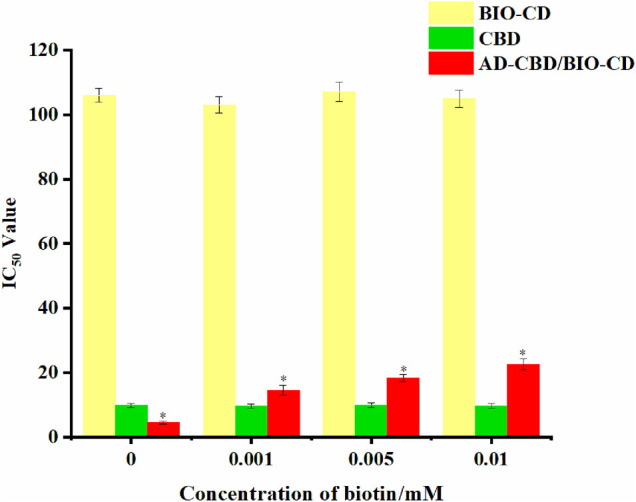
IC50 values of AD-CBD, BIO-CD, and AD-CBD/BIO-CD towards A549 cell lines under different concentrations of biotin (*p < 0.05).
Official websites use .gov
A
.gov website belongs to an official
government organization in the United States.
Secure .gov websites use HTTPS
A lock (
) or https:// means you've safely
connected to the .gov website. Share sensitive
information only on official, secure websites.
IC50 values of AD-CBD, BIO-CD, and AD-CBD/BIO-CD towards A549 cell lines under different concentrations of biotin (*p < 0.05).