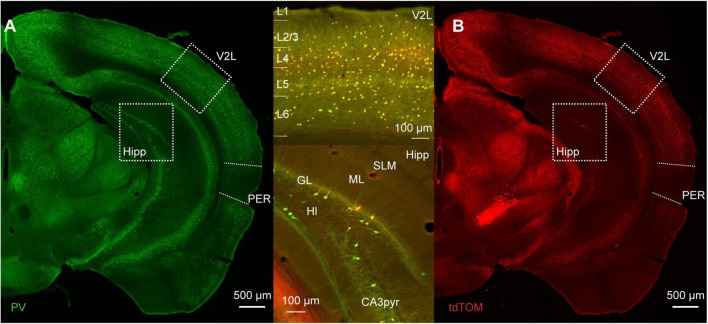
FIGURE 1.
(A) Representative immunofluorescence staining for PV of a slice at about bregma −3 mm of a PVcre/Ai9 mouse. Dotted boxes highlight the lateral part of the secondary visual cortex (V2L) and the hippocampus (Hipp). The perirhinal cortex (PER) is delineated by the dotted line on the lateral side of the brain. (B) Representative image of the immunofluorescence for tdTomato in the same section as (A). Upper insert shows the merged signals in the cortex, and lower insert shows merged signals in the hippocampus (SLM, stratum lacunosum-moleculare; ML, molecular layer; GL, granule layer of the dentate gyrus; Hl, hilus; CA3pyr, pyramidal layer of the CA3 region).

