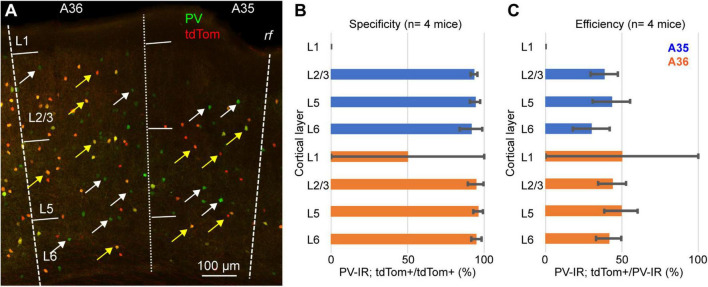
FIGURE 3.
(A) Representative confocal stack showing the overlap of immunofluorescence for PV (green) and tdTomato (red) in PER; yellow arrows indicate double labeled cells and white arrows indicate PV-IR cell that do not express tdTomato. (B) Bar graph showing the specificity of the PV-IRES-Cre mouse line in PER in 4 animals. (C) Bar graph showing the efficacy of the PV-IRES-Cre mouse line in PER in 4 animals.

