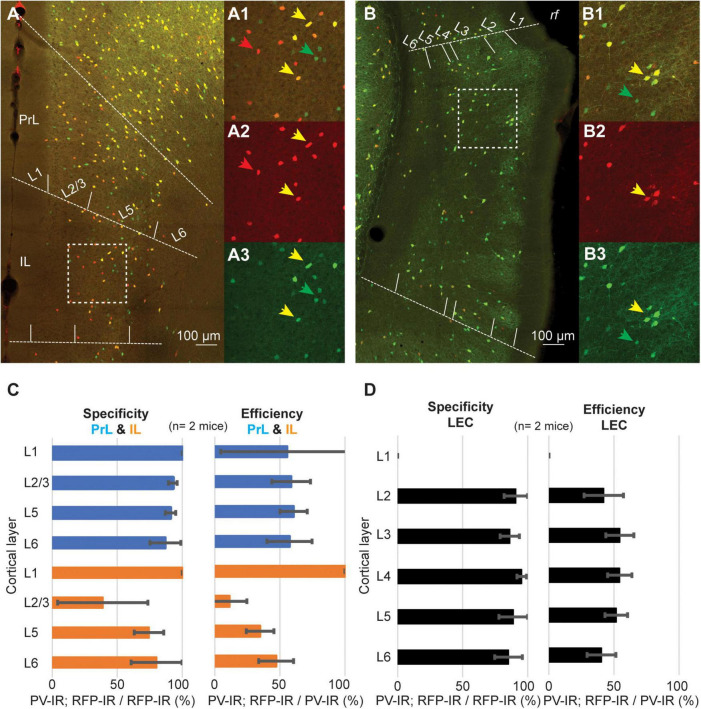
FIGURE 7.
Representative confocal stack showing the overlap of PV (green) and tdTomato (red) in PrL and IL cortex (A), and in LEC (B). Inserts show magnification of the areas highlighted by dotted squares in (A,B) (A1–3, IL; B1–3, LEC). (C) Bar graphs showing the specificity and efficiency of the PV-IRES-Cre mouse line in PrL and IL. (D) Bar graphs showing the specificity and efficiency of the PV-IRES-Cre mouse line in LEC.

