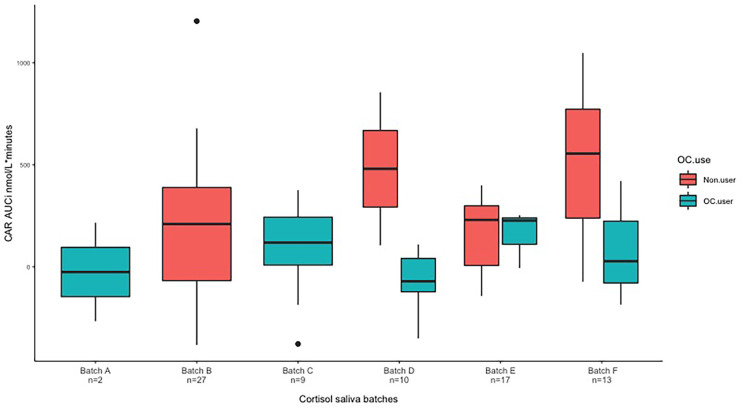
Figure 4.
Variance seen by boxplot based on unadjusted observations. We here present data from six different batches. Batch D: non-users n = 2, OC-users n = 8. Batch E: Non-users n = 14, OC-users n = 3. Batch F: non-users n = 10, OC-users n = 3. CAR, cortisol awakening response; AUCi, area under the curve with respect to increase.

