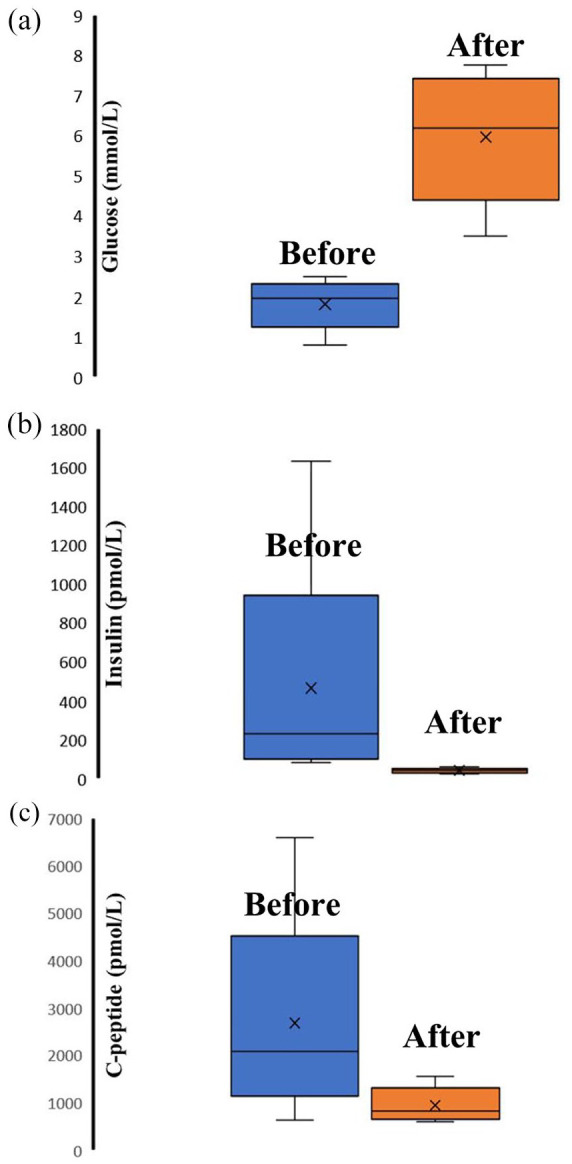
Figure 4.

(a) Serum glucose level before and after EUS-guided radiofrequency and ethanol ablation. (b) Serum insulin level before and after EUS-guided radiofrequency and ethanol ablation. (c) Serum C-peptid level before and after EUS-guided radiofrequency and ethanol ablation.
